Welcome to TeamEmond

  • Home
  • Search
  • Our Listings
  • Buyers
  • Sellers
  • News
  • About TeamEmond
  • Contact
Menu
  • Home
  • Search
  • Our Listings
  • Buyers
  • Sellers
  • News
  • About TeamEmond
  • Contact

25% of Homes with a Mortgage are Now Equity Rich!

September 19, 2018 by simplify

25% of Homes with a Mortgage are Now Equity Rich! | Simplifying The Market

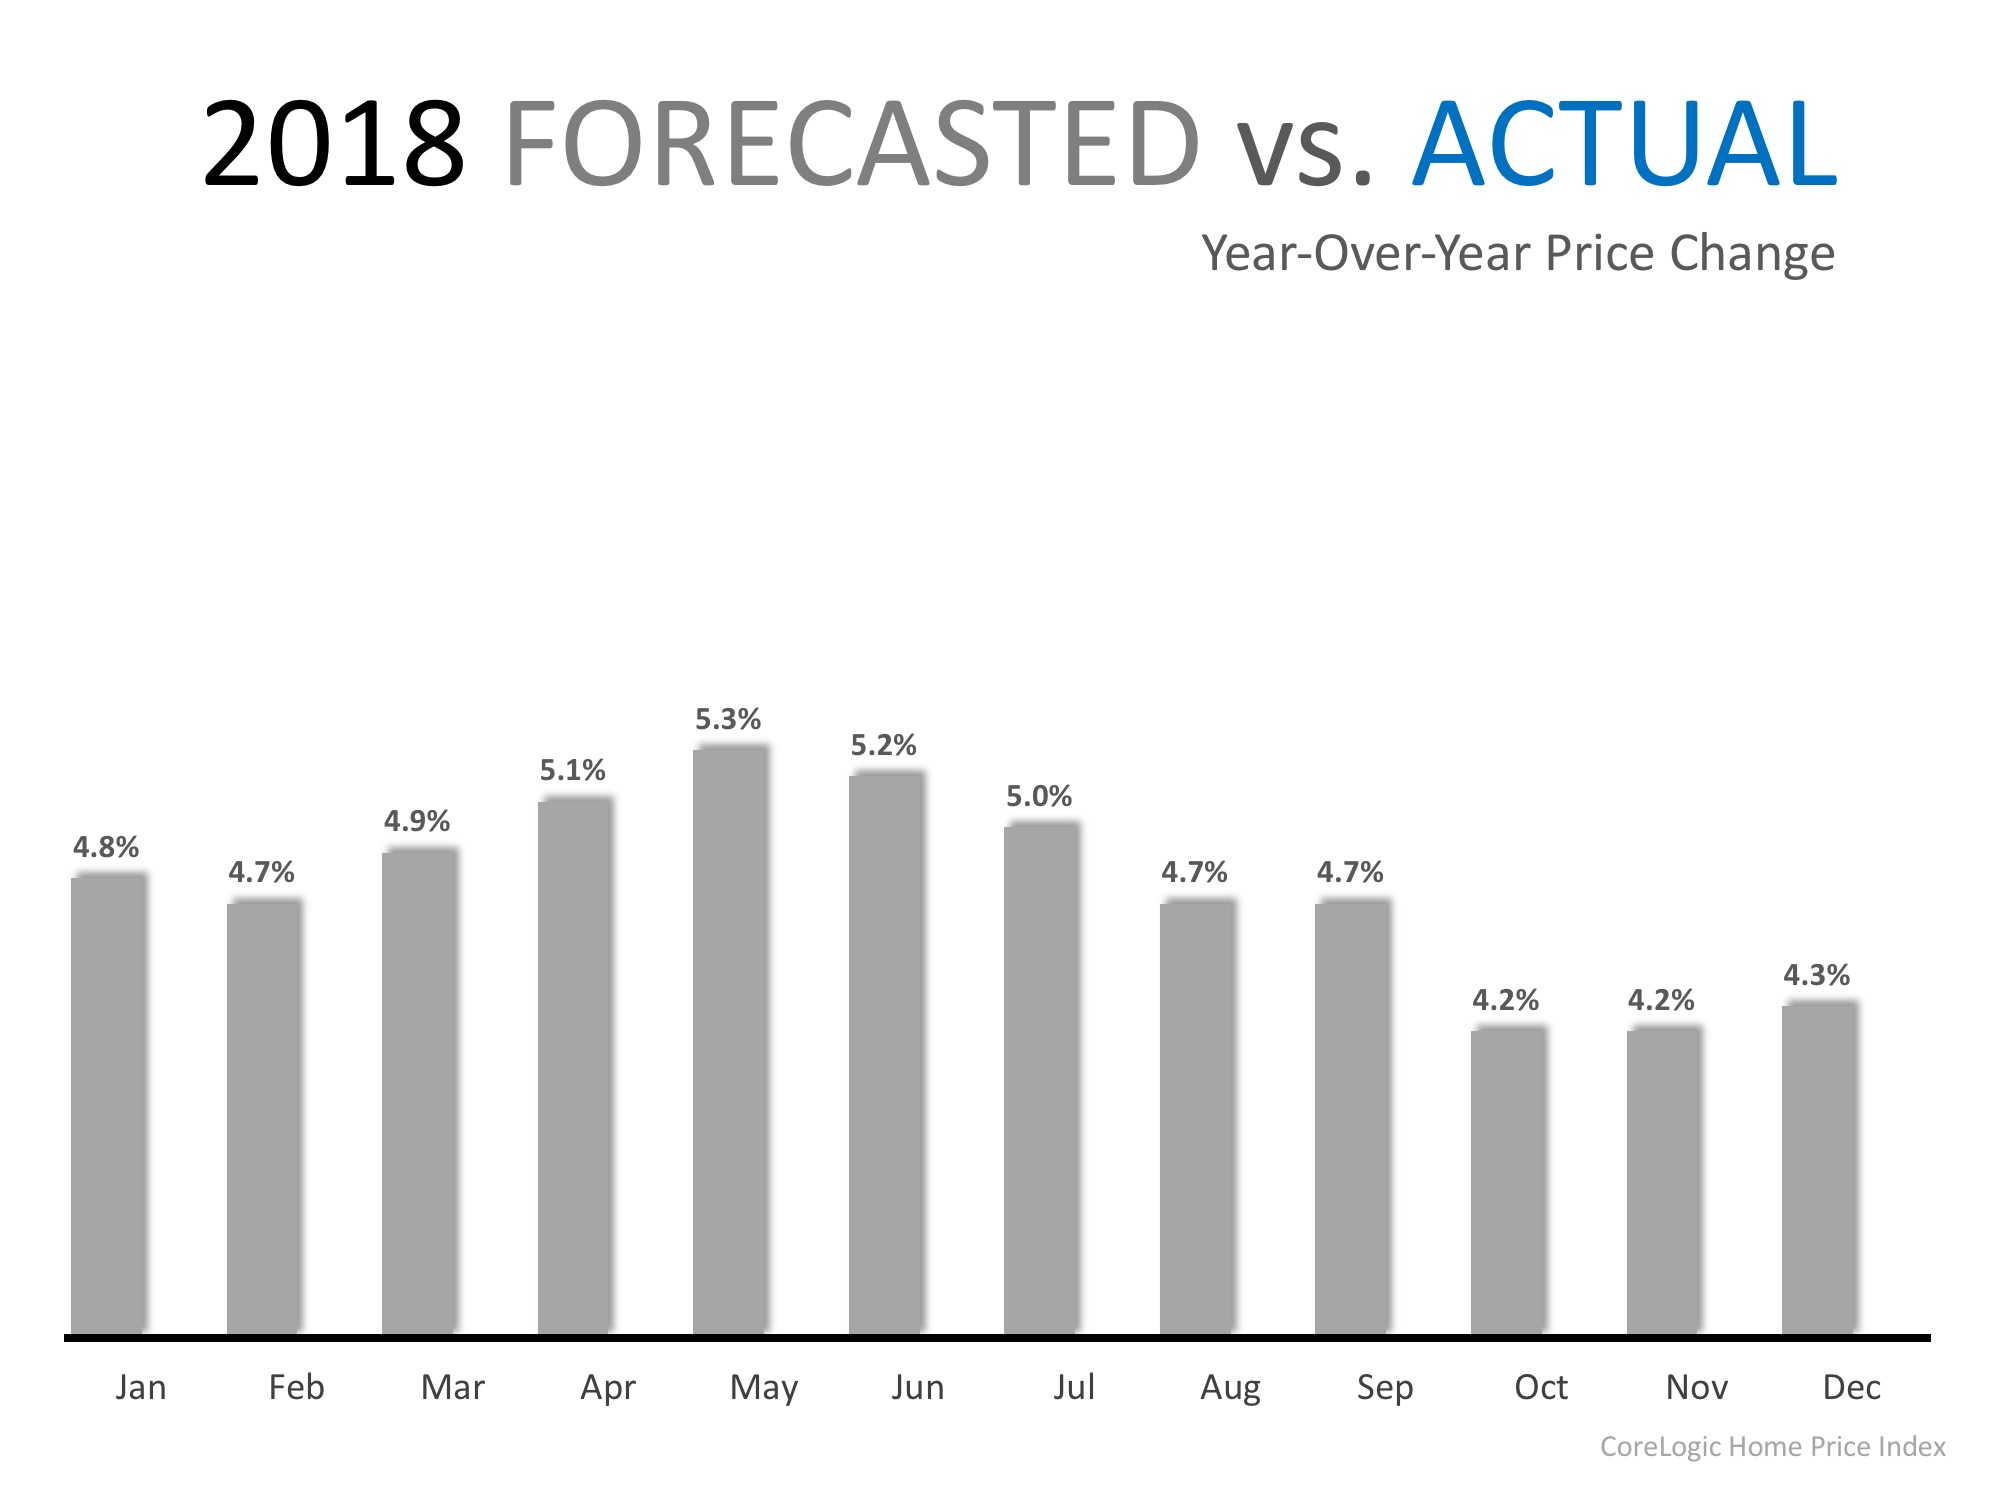
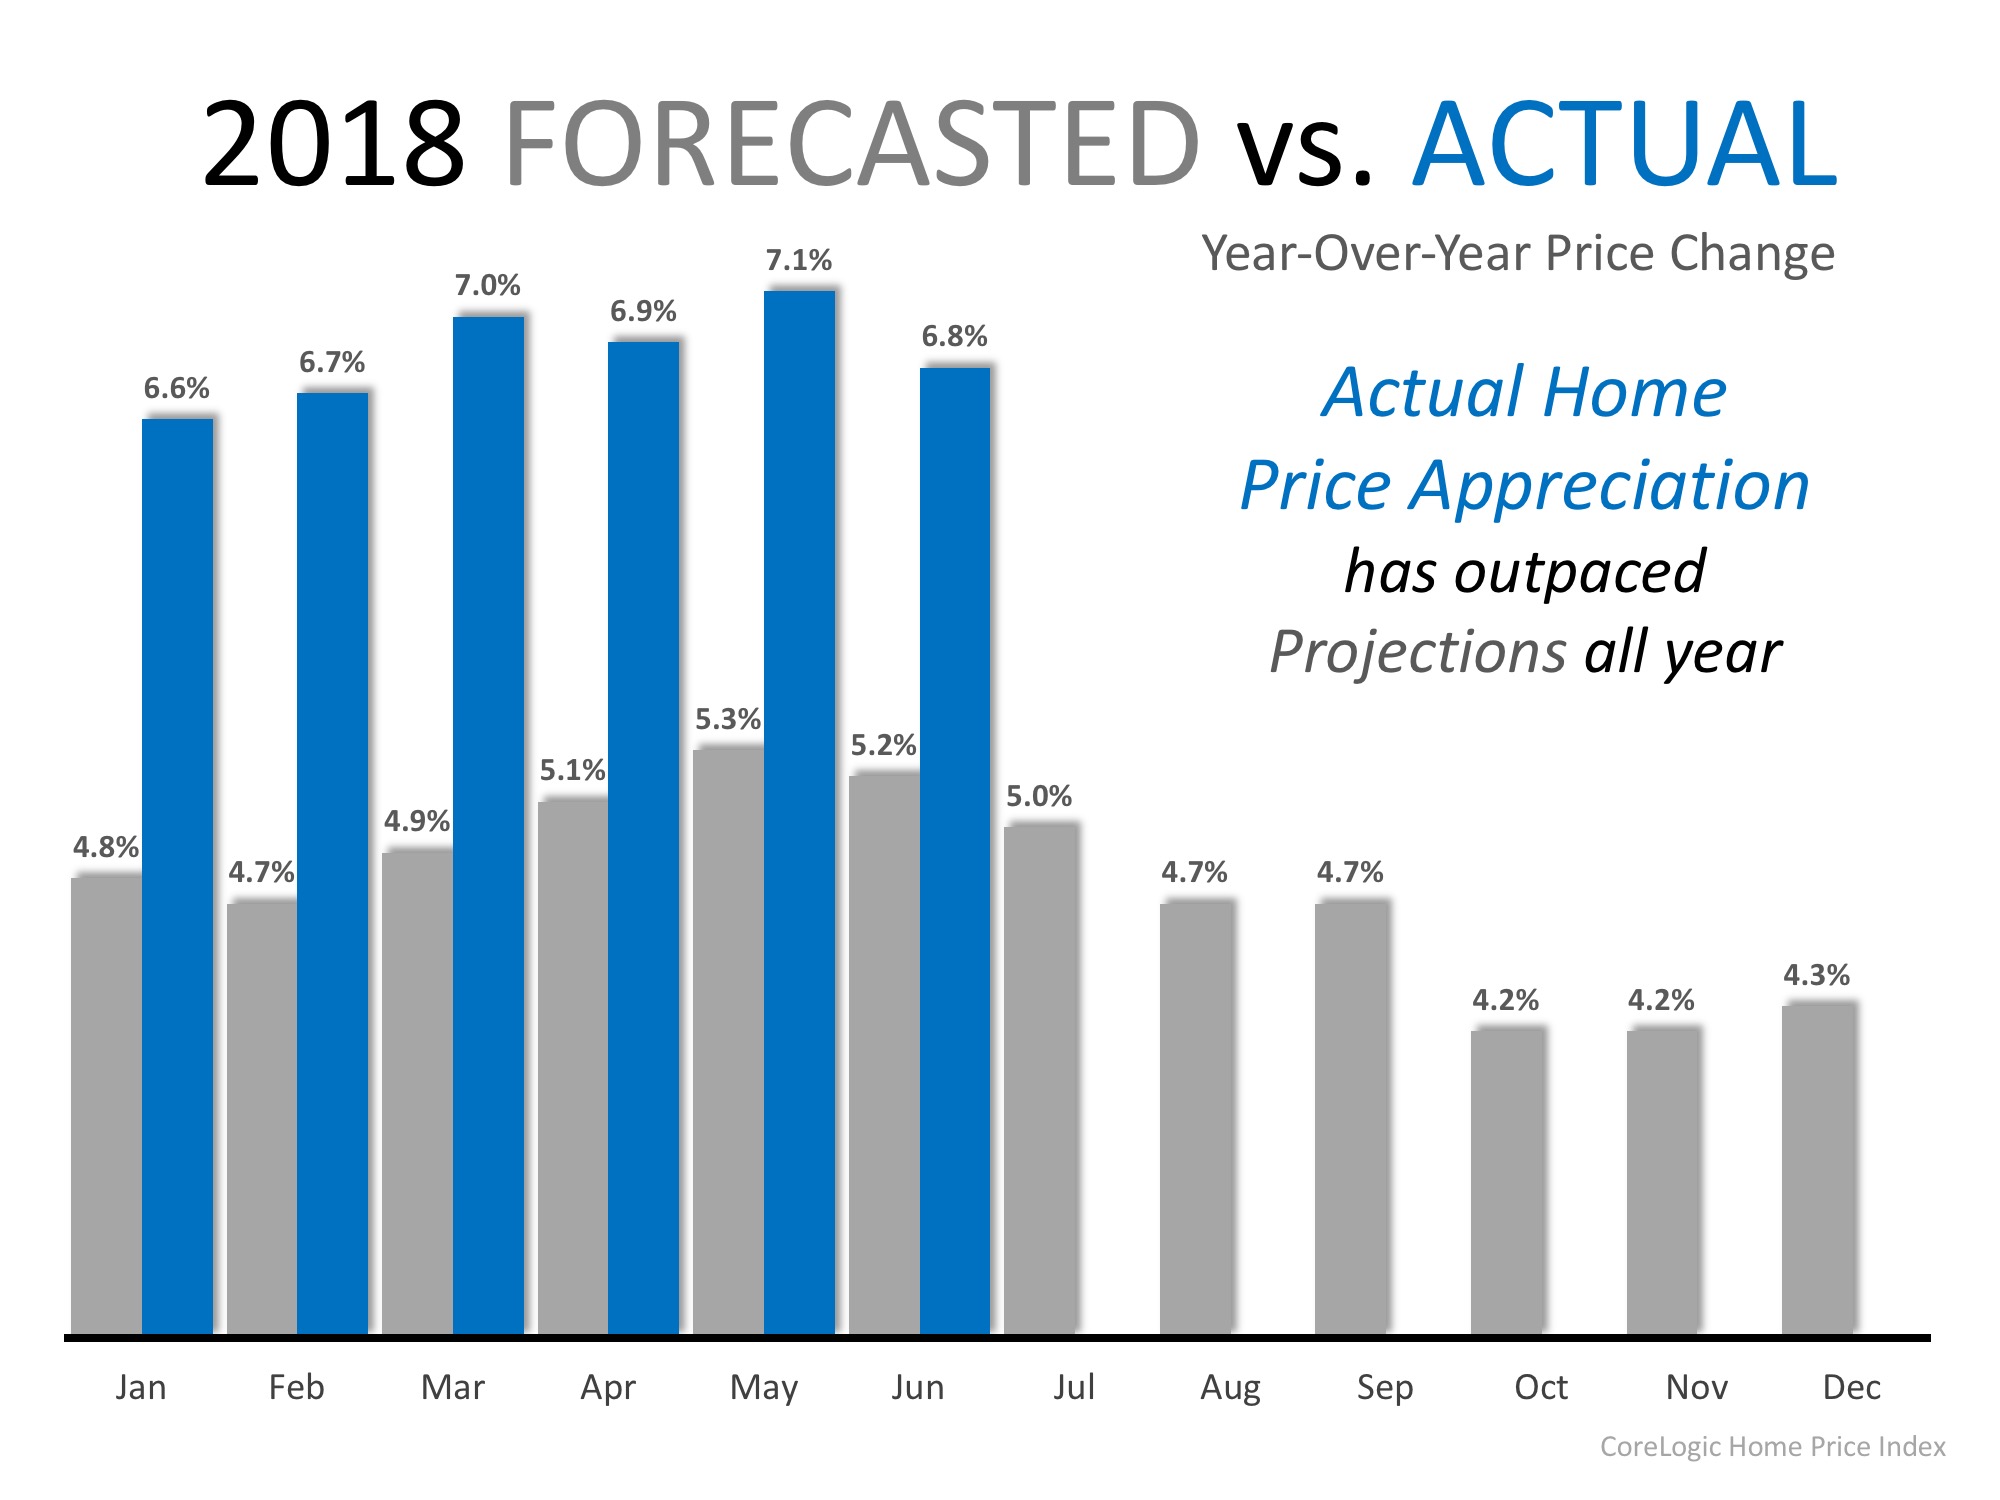
Rising home prices have been in the news a lot lately and much of the focus has been on whether home prices are accelerating too quickly, as well as how sustainable the growth in prices really is. One of the often-overlooked benefits of rising prices, however, is the impact that they have on a homeowner’s equity position.

Home equity is defined as the difference between the home’s fair market value and the outstanding balance of all liens (loans) on the property. While homeowners pay down their mortgages, the amount of equity they have in their homes climbs each time the value of their homes go up!

According to the latest Equity Report from ATTOM Data Solutions, “13.9 million U.S. properties in Q2 2018 were equity rich — where the combined estimated balance of loans secured by the property was 50 percent or less of the property’s estimated market value — representing 24.9% of all U.S. properties with a mortgage.”

This means that nearly a quarter of Americans who have a mortgage would be able to sell their homes and have a significant down payment toward their next home. Many who sell could also use their new-found equity to pay off high-interest credit cards or help children with tuition costs.

The map below shows the percentage of properties with a mortgage in each state that were equity rich in Q2 2018.

25% of Homes with a Mortgage are Now Equity Rich! | Simplifying The Market

Bottom Line

If you are a homeowner looking to take advantage of your home equity by moving up to your dream home, let’s get together to discuss your options!

Filed Under: For Sellers, Housing Market Updates, Move-Up Buyers

Home Prices: The Difference 5 Years Makes

September 18, 2018 by simplify

Home Prices: The Difference 5 Years Makes | Simplifying The Market

CoreLogic recently released their Home Price Index Report. One of the key indicators used in the report to determine the health of the housing market was home price appreciation. CoreLogic focused on appreciation from July 2013 to July 2018 to show how prices over the last five years have fared.

The graph below was created to show the 5-year change in price from July 2013 to July 2018 by price range.

Home Prices: The Difference 5 Years Makes | Simplifying The Market

As you can see in the graph, the highest price appreciation occurred in the lowest price range with 48% growth, while the highest priced homes appreciated by 25%. This has been greatly fueled by the lack of inventory of homes available at the lower price ranges and high demand from first-time buyers looking to enter the market.

Where were prices expected to go?

Every quarter, Pulsenomics surveys a nationwide panel of over 100 economists, real estate experts, and investment and market strategists and asks them to project how residential home prices will appreciate over the next five years for their Home Price Expectation Survey (HPES).

According to the Q3 2014 survey results, national homes prices were projected to increase cumulatively by 19.5% by December 2018. The bulls of the group predicted home prices to rise by 27.8%, while the more cautious bears predicted an appreciation of 11.2%.

Where are prices headed in the next 5 years?

Data from the most recent HPES shows that home prices are expected to increase by 20.0% over the next 5 years. The bulls of the group predict home prices to rise by 31.2%, while the more cautious bears predict an appreciation of 9.3%.

Bottom Line

Every day, thousands of homeowners regain positive equity in their homes. Some homeowners are now experiencing values even greater than those before the Great Recession. If you’re wondering if you have enough equity to sell your house and move on to your dream home, let’s get together to discuss conditions in our neighborhood!

Filed Under: First Time Home Buyers, For Buyers, For Sellers, Housing Market Updates, Move-Up Buyers, Pricing

If You Are Thinking of Selling? You Must Act NOW!

September 17, 2018 by simplify

If You Are Thinking of Selling? You Must Act NOW! | Simplifying The Market

If you thought about selling your house this year, now more than ever may be the time to do it! The inventory of homes for sale is well below historic norms and buyer demand is skyrocketing. We were still in high school when we learned about the concept of supply and demand, so we understand that the best time to sell something is when the supply of that item is low and demand for that item is high. That defines today’s real estate market.

Lawrence Yun, Chief Economist at the National Association of Realtors, recently commented:

“Contract signings inched backward once again last month, as declines in the South and West weighed down on overall activity.”

Yun goes on to say:

“The reason sales are falling off last year’s pace is that multiple years of inadequate supply in markets with strong job growth have finally driven up home prices to a point where an increasing number of prospective buyers are unable to afford it.”

In this type of market, a seller may hold a major negotiating advantage when it comes to price and other aspects of the real estate transaction, including the inspection, appraisal and financing contingencies.

Bottom Line

As a potential seller, you are in the driver’s seat right now. It might be time to hit the gas.

Filed Under: For Sellers, Housing Market Updates, Move-Up Buyers

Are Homebuyers Starting to Hit the ‘Pause’ Button?

September 13, 2018 by simplify

Are Homebuyers Starting to Hit the ‘Pause’ Button? | Simplifying The Market

For the last several years, buyer demand has far exceeded the housing supply available for sale. This low supply and high demand have led to home prices appreciating by an average of 6.2% annually since 2012.

With this being said, three of the four major reports used to measure buyer activity have revealed that purchasing demand may be softening. Here are the four indices, how they measure demand (methodology), what their latest reports said, and a quick synopsis of the report.

The Foot Traffic Report
by the National Association of Realtors

Methodology: Every month SentriLock, LLC provides NAR Research with data on the number of properties shown by a REALTOR®. Lockboxes made by SentriLock, LLC are used in roughly a third of home showings across the nation. Foot traffic has a strong correlation with future contracts and home sales, so it can be viewed as a peek ahead at sales trends two to three months into the future.

Latest Report: “Foot Traffic climbed 3.2 points to 55.8 mid-summer in July. Additionally, the diffusion index is higher than last year by 13.5 points. Despite a healthy economy and labor market, supply and new construction remains unable to keep up with buyer demand.”

Synopsis: Buyer demand remains strong.

The Showing Index
by ShowingTime

Methodology: The ShowingTime Showing Index® tracks the average number of buyer showings on active residential properties on a monthly basis, a highly reliable leading indicator of current and future demand trends.

Latest Report: “Showing activity throughout the country increased by 0.3 percent year over year in July, the third consecutive month that the U.S. ShowingTime Showing Index recorded buyer interest deceleration compared to the previous year. The June 2018 figures revealed a 0.0 percent change in showing traffic from 2017, while May showed a 1.2 percent year-over-year increase. The 12-month average year-over-year increase was 4.6 percent.”

Synopsis: Buyer demand is softening

Realtors Confidence Index
by the National Association of Realtors

Methodology: The REALTORS Confidence Index is a key indicator of housing market strength based on a monthly survey sent to over 50,000 real estate practitioners. Practitioners are asked about their expectations for home sales, prices and market conditions.

Latest Report: “REALTORS reported slower homebuying activity in July 2018…The REALTORS® Buyer Traffic Index registered at 62, down from the same month one year ago (69). This is the fifth straight month (since March 2018) that Realtors reported a decline in buyer activity compared to conditions one year ago.”

Synopsis: Buyer demand is softening

The Real Estate Broker Survey
in the ‘Z’ Report by Zelman and Associates (subscription needed)

Methodology: Proprietary survey results of real estate executives.

Latest Report: “While we continue to expect a resumption of growth in resale transactions on the back of easing inventory in 2019 and 2020, our real-time view into the market through our Real Estate Broker Survey does suggest that buyers have grown more discerning of late and a level of “pause” has taken hold in many large housing markets. Indicative of this, our broker contacts rated buyer demand at 69 on a 0-100 scale, still above average but down from 74 last year and representing the largest year-over-year decline in the two-year history of our survey.”

Synopsis: Buyer demand is softening

Bottom Line

Again, three of the four most reliable measures of buyer activity are reporting that demand is softening. We had a strong buyers’ market directly after the housing crash which was immediately followed by a strong sellers’ market over the last six years.

If demand continues to soften and supply begins to grow (as is projected to happen), we will return to a more neutral market which will favor neither buyers nor sellers. This “more normal” market will be better for real estate in the long term.

Filed Under: First Time Home Buyers, For Buyers, For Sellers, Housing Market Updates, Move-Up Buyers

Home Prices Have Appreciated 6.9% in 2018

September 12, 2018 by simplify

Home Prices Have Appreciated 6.9% in 2018 | Simplifying The Market

Between 1987 and 1999, which is often referred to as the ‘Pre-Bubble Period,’ home prices grew at an average of 3.6% according to the Home Price Expectation Survey.

Every month, the economists at CoreLogic release the results of their Home Price Insights Report, which includes the actual year-over-year change in prices across the country and their predictions for the following year.

The chart below shows the forecasted year-over-year prices for 2018 (predictions made in 2017). According to their predictions, the average appreciation over the course of 2018 should be 4.8%, which is still greater than the ‘normal’ appreciation of 3.6%.

Home Prices Have Appreciated 6.9% in 2018 | Simplifying The Market

If we layer in the actual price appreciation that has occurred this year, we can see that over the course of 2018, home prices have appreciated by an average of 6.9% and have outpaced projections all year!

Home Prices Have Appreciated 6.9% in 2018 | Simplifying The Market

What does this mean?

The tale of today’s real estate market is one of low inventory, high demand, and rising prices. The forces at work can be simply explained with the theory of supply and demand. That being said, if a large supply of inventory were to come to the market, prices may start to appreciate closer to the forecasted rate which would STILL be greater than the historic norm!

Bottom Line

If you are a homeowner whose house no longer meets your needs, now may be a great time to list your home and capitalize on the equity you have gained over the last year to make a significant down payment on your next home!

Filed Under: For Sellers, Housing Market Updates, Move-Up Buyers, Pricing

NAR Reports Show It’s A Great Time to Sell!

September 11, 2018 by simplify

NAR Reports Show It’s A Great Time to Sell! | Simplifying The Market

We all realize that the best time to sell anything is when the demand for that item is high and the supply of that item is limited. The last two major reports issued by the National Association of Realtors (NAR) revealed information that suggests that right now continues to be a great time to sell your house.

Let’s look at the data covered in the latest Pending Home Sales Report and Existing Home Sales Report.

THE PENDING HOME SALES REPORT

The report announced that pending home sales (homes going into contract) are down 2.3% from last year and have continued to fall on an annual basis for seven straight months.

Lawrence Yun, NAR’s Chief Economist, had this to say:

“The reason sales are falling off last year’s pace is that multiple years of inadequate supply in markets with strong job growth have finally driven up home prices to a point where an increasing number of prospective buyers are unable to afford it.”

Takeaway: Demand for housing is strong and will continue to grow in 2019. Without an influx of new listings for sale, pending home sales will continue to decline. Listing now means you will be able to take advantage of the demand currently in the market.

THE EXISTING HOME SALES REPORT

The most important data point revealed in the report was not sales-based, but was instead the inventory of homes for sale (supply). The report explained:

  • Total housing inventory decreased 0.7% to 5.34 million homes available for sale in July
  • This represents a 4.3-month supply at the current sales pace
  • Sales are now 1.5% below a year ago

There were two more interesting comments made by Yun in the report:

“Led by a notable decrease in closings in the Northeast, existing home sales trailed off again last month, sliding to their slowest pace since February 2016 at 5.21 million.”

In real estate, there is a guideline that often applies: When there is less than a 6-month supply of inventory available, we are in a seller’s market and we will see appreciation; between 6-7 months is a neutral market, where prices will increase at the rate of inflation; and more than a 7-month supply means we are in a buyer’s market and should expect depreciation in home values. As Yun notes, we are (and will remain) in a seller’s market and prices will continue to increase unless more listings come to the market.

“Listings continue to go under contract in under a month, which highlights the feedback from Realtors® that buyers are swiftly snatching up moderately-priced properties. Existing supply is still not at a healthy level, and new home construction is not keeping up to meet demand.”

Takeaway: Inventory of homes for sale is still well below the 6-month supply needed for a normal market. Prices will continue to rise if a sizable supply does not enter the market.

Bottom Line

If you are going to sell, now may be the time to take advantage of the ready, willing, and able buyers that are still out looking for your house.

Filed Under: For Sellers, Housing Market Updates, Move-Up Buyers

  • « Previous Page
  • 1
  • …
  • 64
  • 65
  • 66
  • 67
  • 68
  • …
  • 74
  • Next Page »
Information Deemed Reliable But Not Guaranteed
Licensed In MN

Copyright © 2025 | TeamEmond