Welcome to TeamEmond

  • Home
  • Search
  • Our Listings
  • Buyers
  • Sellers
  • News
  • About TeamEmond
  • Contact
Menu
  • Home
  • Search
  • Our Listings
  • Buyers
  • Sellers
  • News
  • About TeamEmond
  • Contact

House-Buying Power at Near-Historic Levels

July 12, 2018 by simplify

House-Buying Power at Near-Historic Levels | Simplifying The Market

We keep hearing that home affordability is approaching crisis levels. While this may be true in a few metros across the country, housing affordability is not a challenge in the clear majority of the country. In their most recent Real House Price Index, First American reported that consumer “house-buying power” is at “near-historic levels.”

Their index is based on three components:

  1. Median Household Income
  2. Mortgage Interest Rates
  3. Home Prices

The report explains:

“Changing incomes and interest rates either increase or decrease consumer house-buying power or affordability. When incomes rise and/or mortgage rates fall, consumer house-buying power increases.”

Combining these three crucial pieces of the home purchasing process, First American created an index delineating the actual home-buying power that consumers have had dating back to 1991.

Here is a graph comparing First American’s consumer house-buying power (blue area) to the actual median home price that year from the National Association of Realtors (yellow line).

House-Buying Power at Near-Historic Levels | Simplifying The Market

Consumer house-buyer power has been greater than the actual price of a home since 1991. And, the spread is larger over the last decade.

Bottom Line

Even though home prices are increasing rapidly and are now close to the values last seen a decade ago, the actual affordability of a home is much better now. As Chief Economist Mark Fleming explains in the report:

“Though unadjusted house prices have risen to record highs, consumer house-buying power stands at near-historic levels, as well, signaling that real house prices are not even close to their historical peak.”

Filed Under: Buying Myths, First Time Home Buyers, For Buyers, Move-Up Buyers, Pricing

Homes More Affordable Today than 1985-2000

July 5, 2018 by simplify

Homes More Affordable Today than 1985-2000 | Simplifying The Market

Rising home prices have many concerned that the average family will no longer be able to afford the most precious piece of the American Dream – their own home.

However, it is not just the price of a home that determines its affordability. The monthly cost of a home is determined by the price and the interest rate on the mortgage used to purchase it.

Today, mortgage interest rates stand at about 4.5%. The average annual mortgage interest rate from 1985 to 2000 was almost double that number, at 8.92%. When comparing affordability of homeownership over the decades, we must also realize that incomes have increased.

This is why most indexes use the percentage of median income required to make monthly mortgage payments on a typical home as the point of comparison.

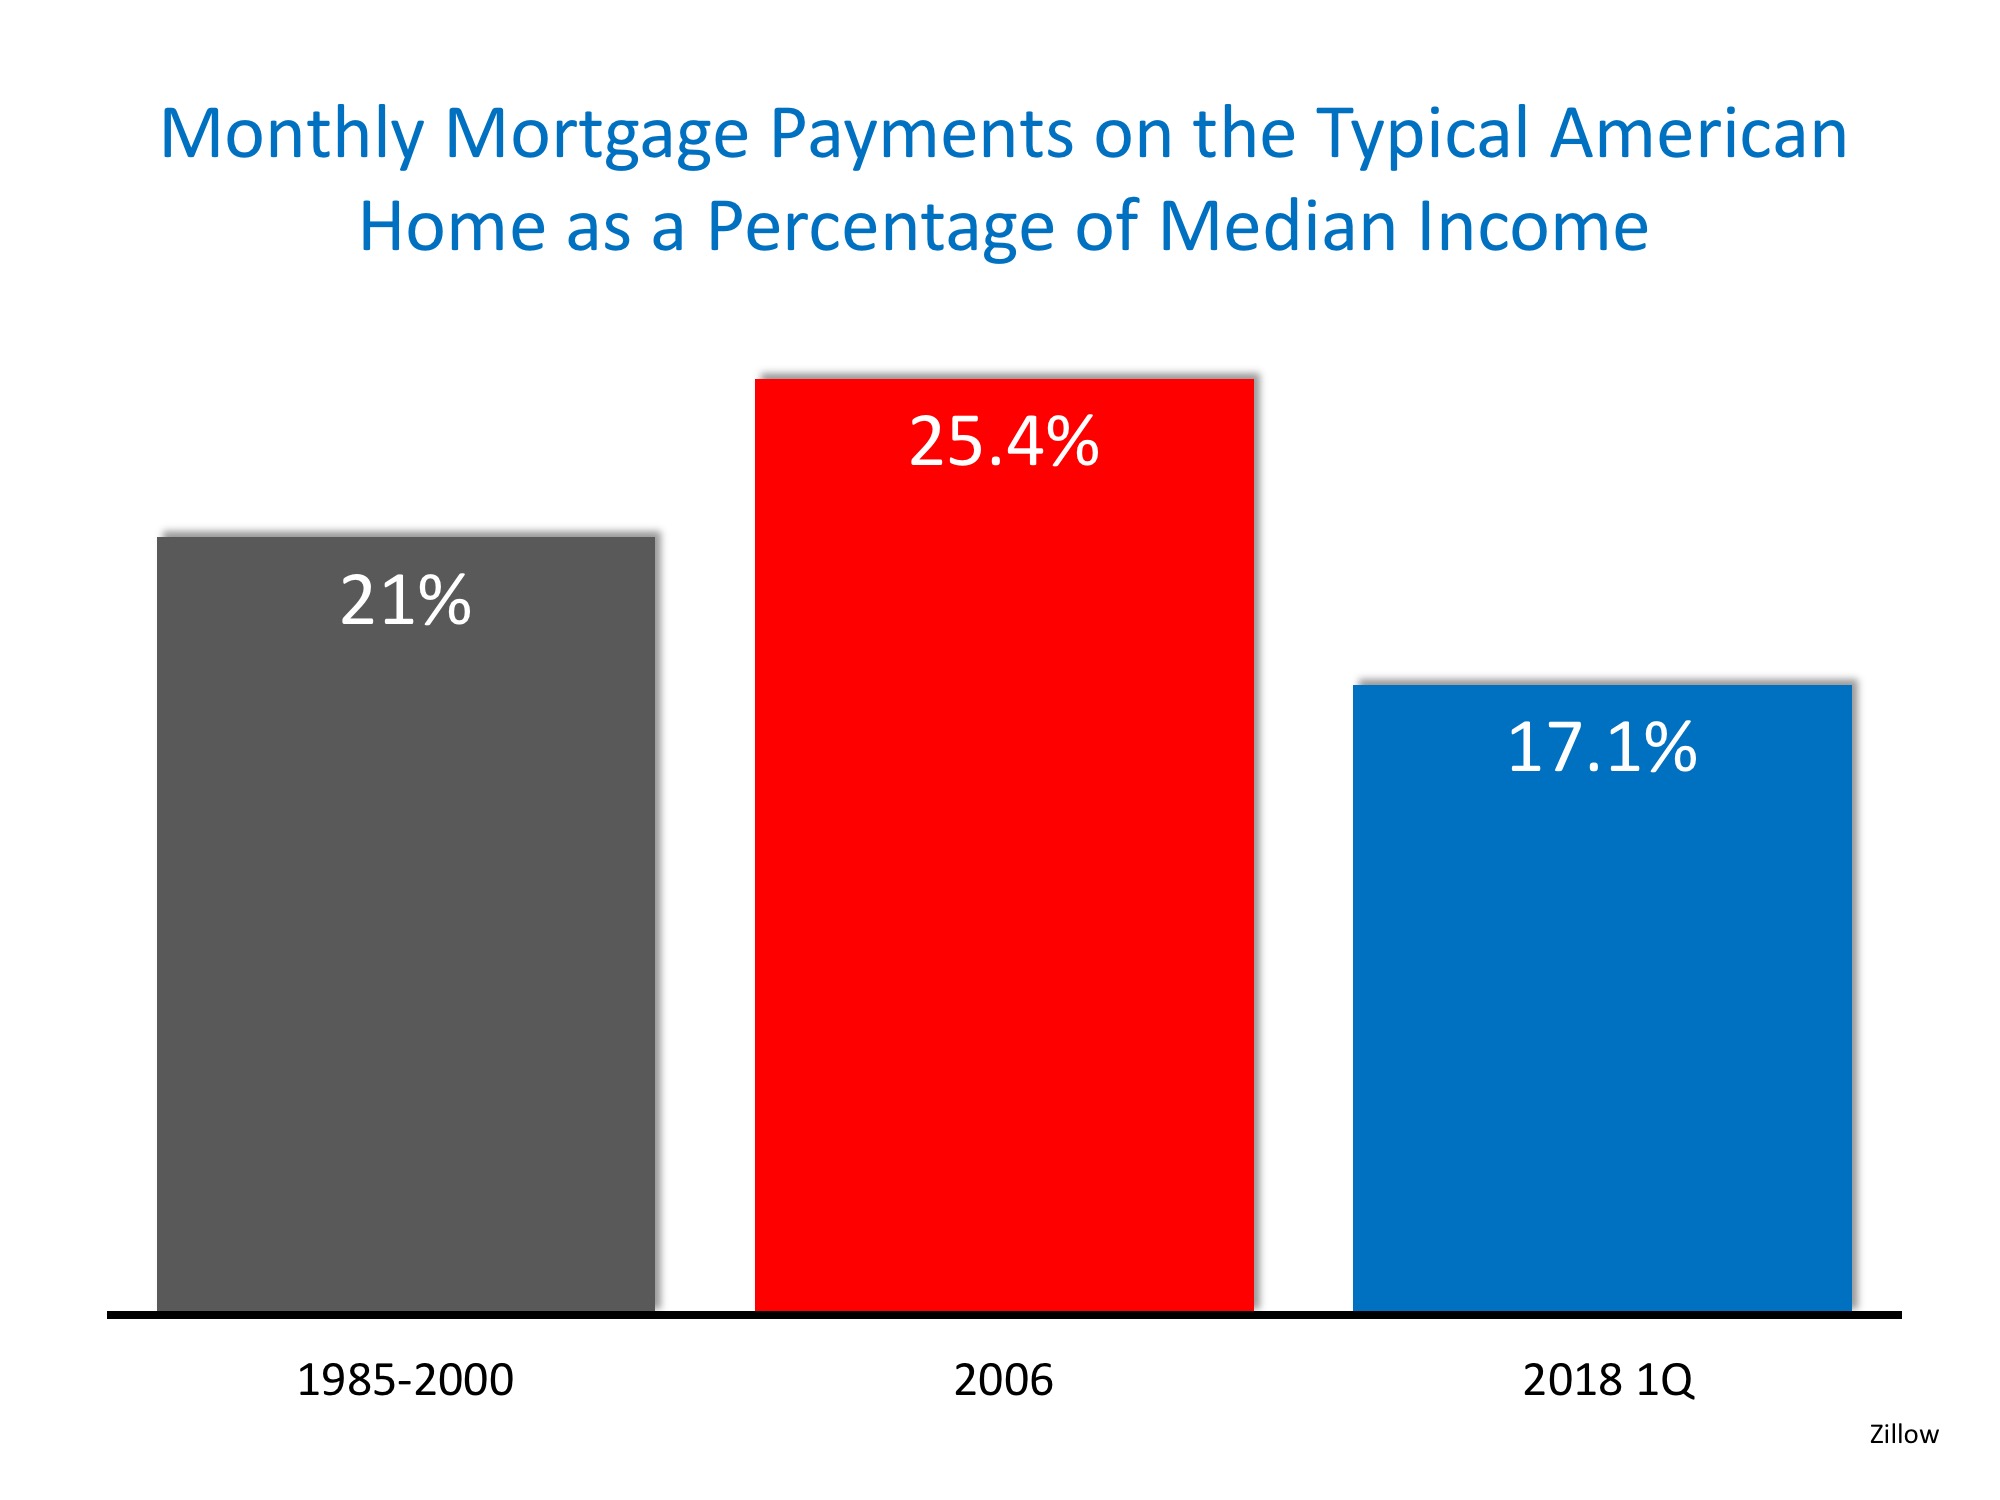
Zillow recently released a report comparing home affordability over the decades using this formula. The report revealed that, though homes are less affordable this year than last year, they are more affordable today (17.1%) than they were between 1985-2000 (21%). Additionally, homes are more affordable now than at the peak of the housing bubble in 2006 (25.4%). Here is a chart of these findings:

Homes More Affordable Today than 1985-2000 | Simplifying The Market

What will happen when mortgage interest rates rise?

Most experts think that the mortgage interest rate will increase to about 5% by year’s end. How will that impact affordability? Zillow also covered this in their report:

Homes More Affordable Today than 1985-2000 | Simplifying The Market

Rates would need to approach 6% before homes became less affordable than they had been historically.

Bottom Line

Though homes are less affordable today than they were last year, they are still a great purchase while interest rates are below the 6% mark.

Filed Under: First Time Home Buyers, For Buyers, Housing Market Updates, Move-Up Buyers, Pricing

Next Recession in 2020? What Will Be the Impact?

June 28, 2018 by simplify

Next Recession in 2020? What Will Be the Impact? | Simplifying The Market

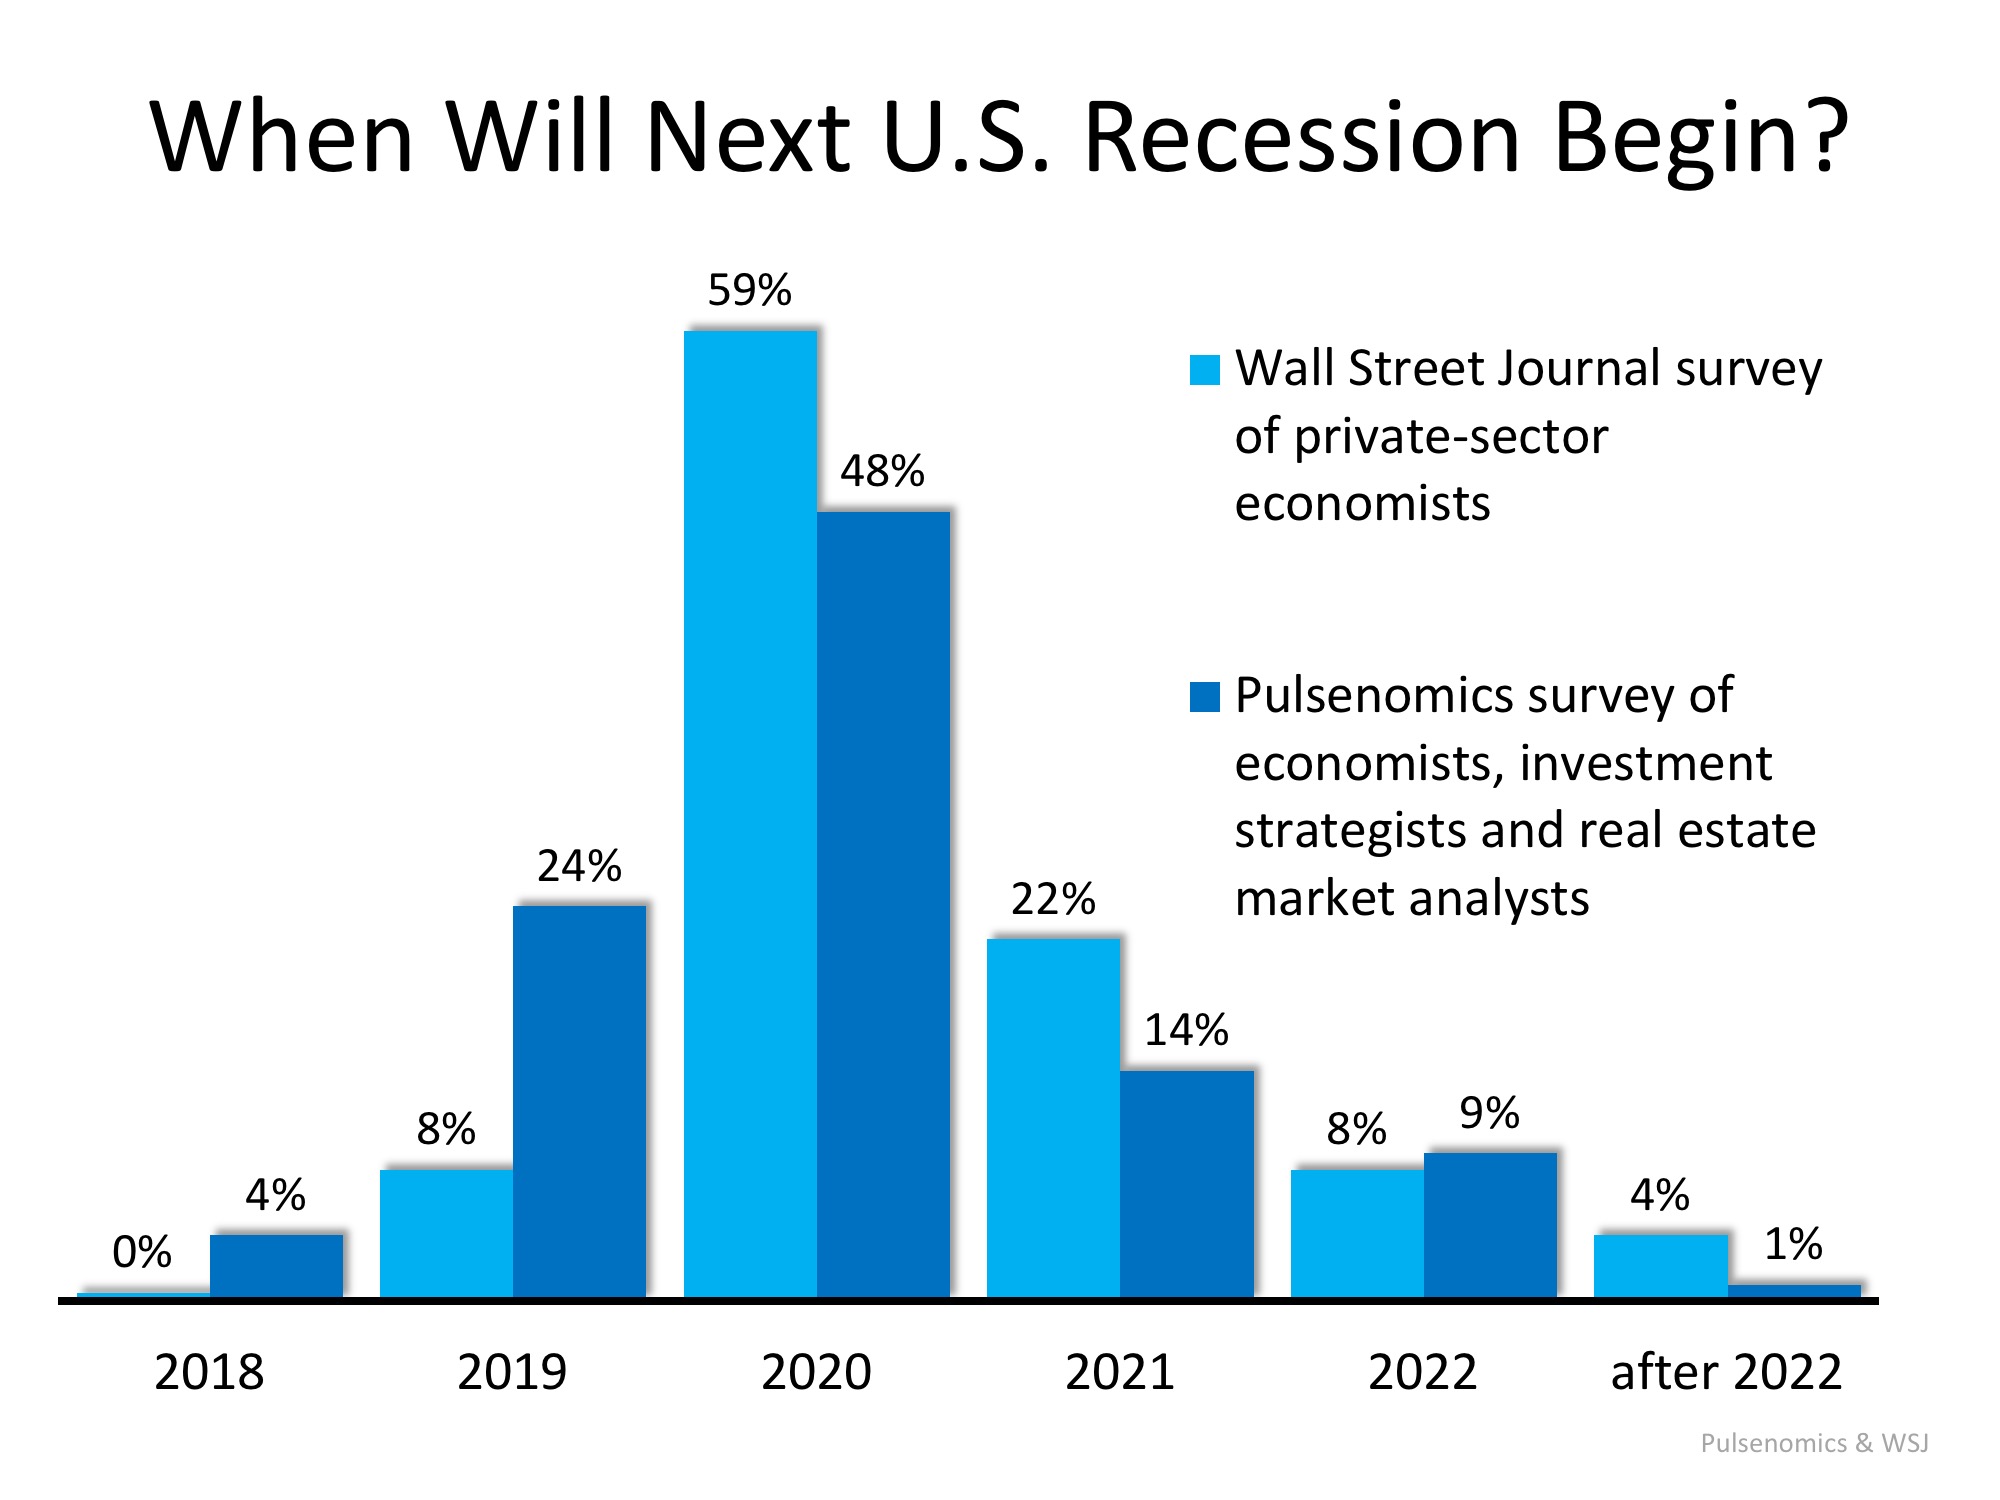
Economists and analysts know that the country has experienced economic growth for almost a decade. They also know that a recession can’t be too far off. A recent report by Zillow Research shed light on a survey conducted by Pulsenomics in which they asked economists, investment strategists and market analysts how they felt about the current housing market. That report revealed the possible timing of the next recession:

“Experts largely expect the next recession to begin in 2020.”

That timing concurs with a recent survey of economists by the Wall Street Journal:

“The economic expansion that began in mid-2009 and already ranks as the second-longest in American history most likely will end in 2020 as the Federal Reserve raises interest rates to cool off an overheating economy, according to forecasters surveyed.”

Here is a graph comparing the opinions of those surveyed by both the Wall Street Journal and Pulsenomics:

Next Recession in 2020? What Will Be the Impact? | Simplifying The Market

Recession DOES NOT Equal Housing Crisis

According to the Merriam-Webster Dictionary, a recession is defined as follows:

“A period of temporary economic decline during which trade and industrial activity are reduced, generally identified by a fall in GDP in two successive quarters.”

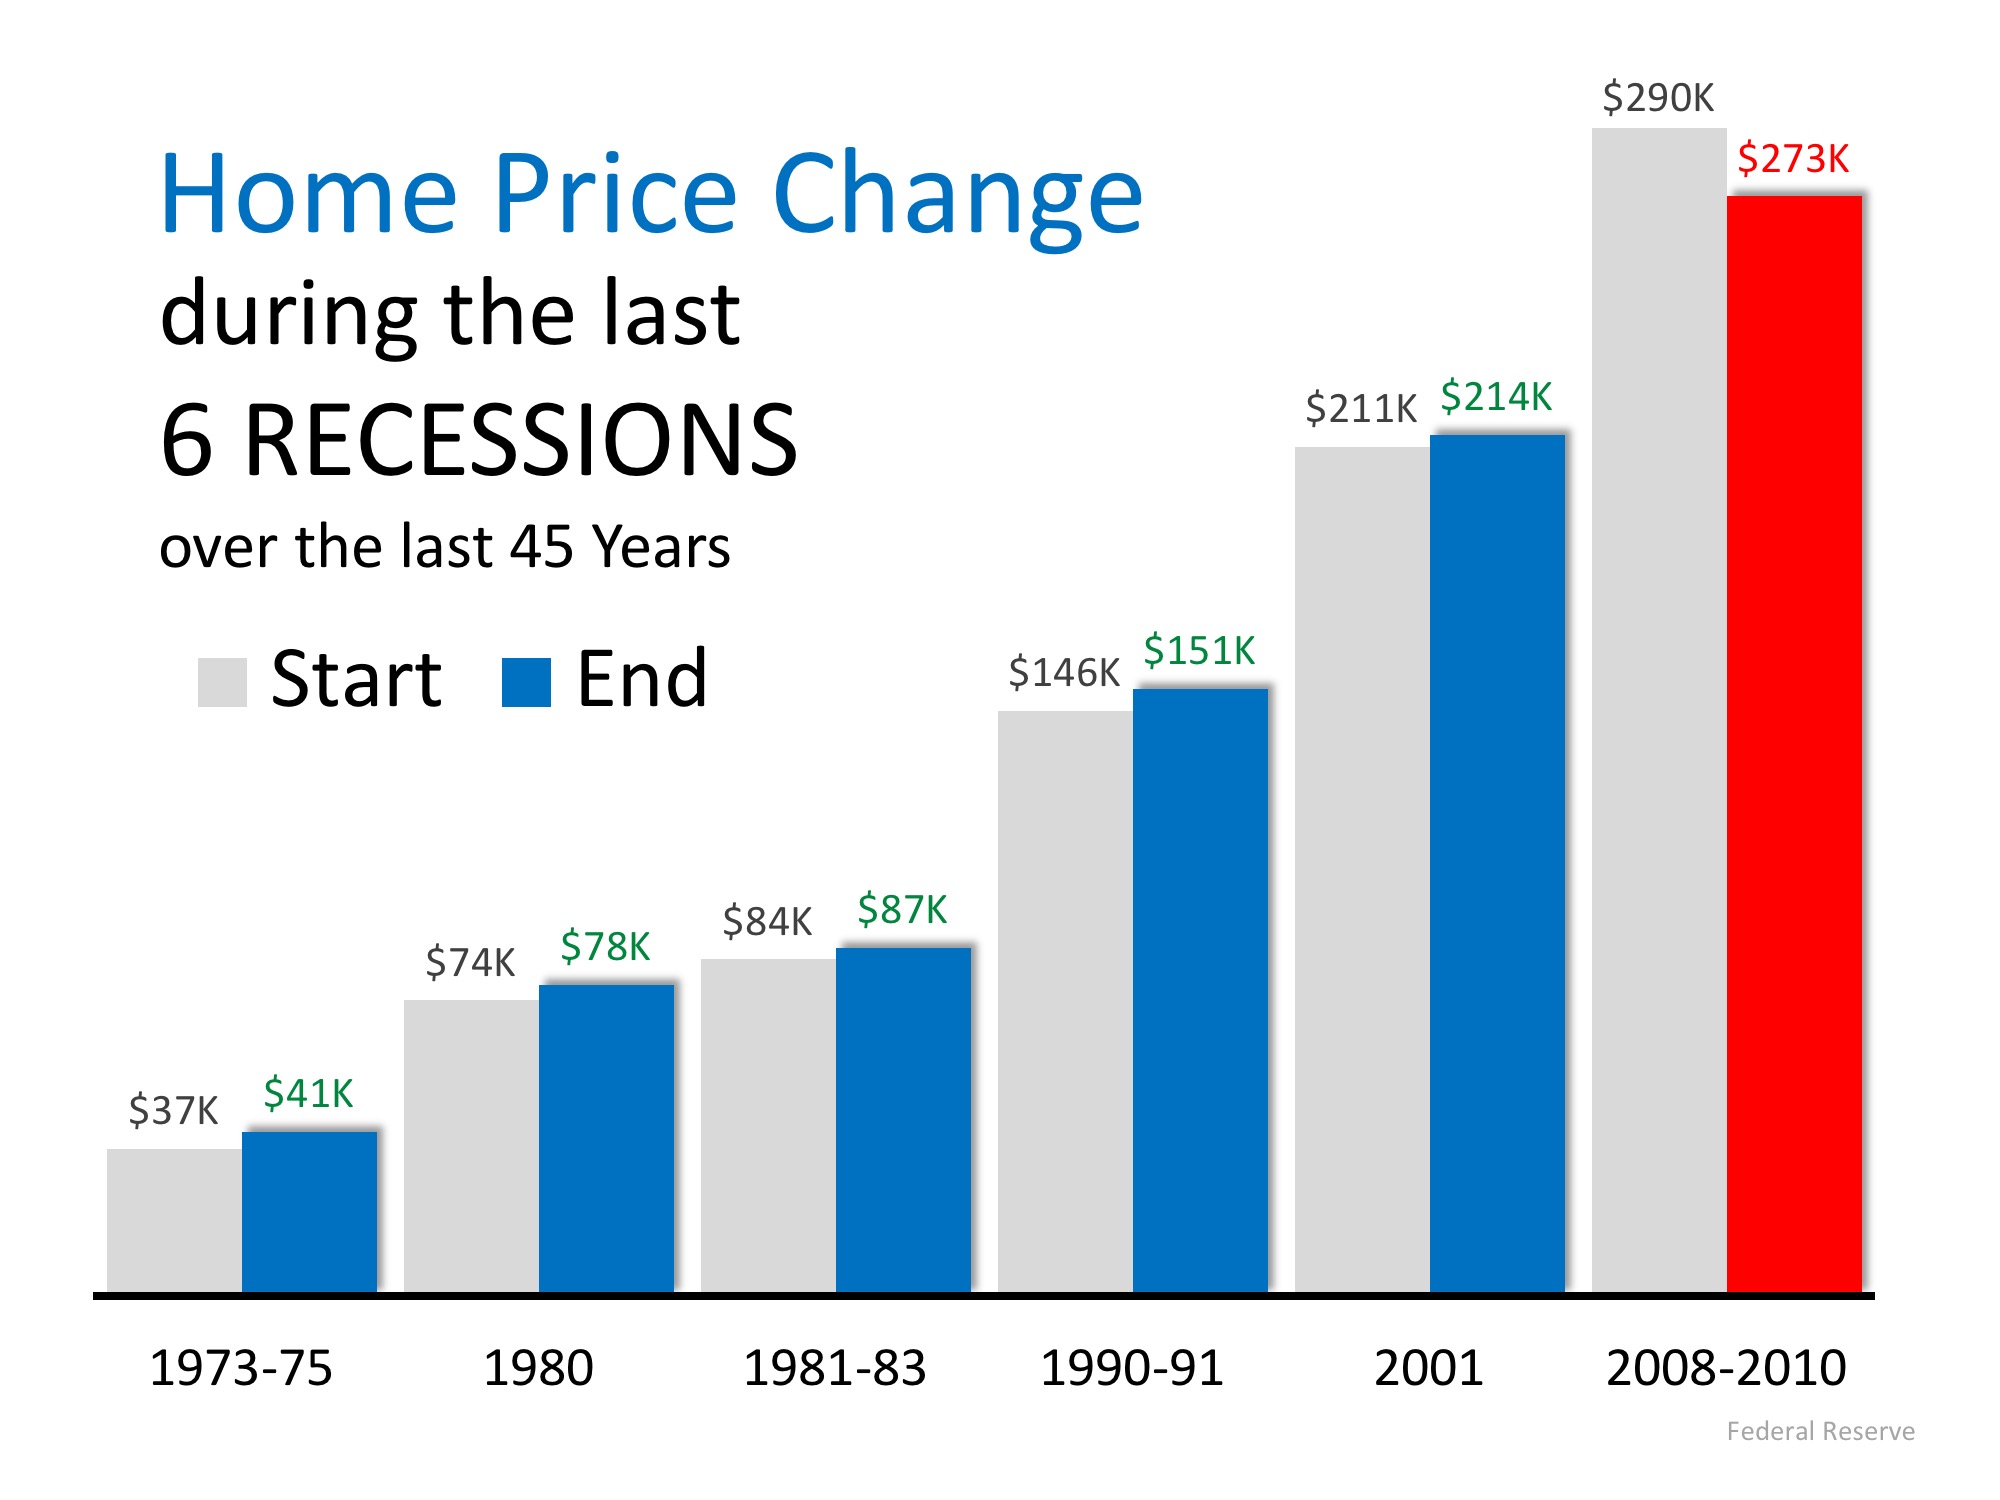
A recession means the economy has slowed down markedly. It does not mean we are experiencing another housing crisis. Obviously, the housing crash of 2008 caused the last recession. However, during the previous five recessions home values appreciated.

Next Recession in 2020? What Will Be the Impact? | Simplifying The Market

According to the experts surveyed by Pulsenomics, the top three probable triggers for the next recession are:

  • Monetary policy
  • Trade policy
  • A stock market correction

A housing market correction was ranked ninth in probability. Those same experts also projected that home values would continue to appreciate in 2019, 2020, 2021 and 2022.  

Others agree that housing will not be impacted like it was a decade ago.

Mark Fleming, First American’s Chief Economist, explained:

“If a recession is to occur, it is unlikely to be caused by housing-related activity, and therefore the housing sector should be one of the leading sources to come out of the recession.”

And U.S. News and World Report agreed:

“Fortunately – and hopefully – the history of recessions and current issues that could harm the economy don’t lead many to believe the housing market crash will repeat itself in an upcoming decline.”

Bottom Line

A recession is probably less than two years away. A housing crisis is not.

Filed Under: For Buyers, For Sellers, Housing Market Updates, Pricing

What’s the Median Home Value in Your State?

June 27, 2018 by simplify

What’s the Median Home Value in Your State? | Simplifying The Market

If you’ve entered the real estate market as a buyer or a seller, you’ve inevitably heard the mantra “location, location, location” in reference to identical homes increasing or decreasing in value based on where they’re located.

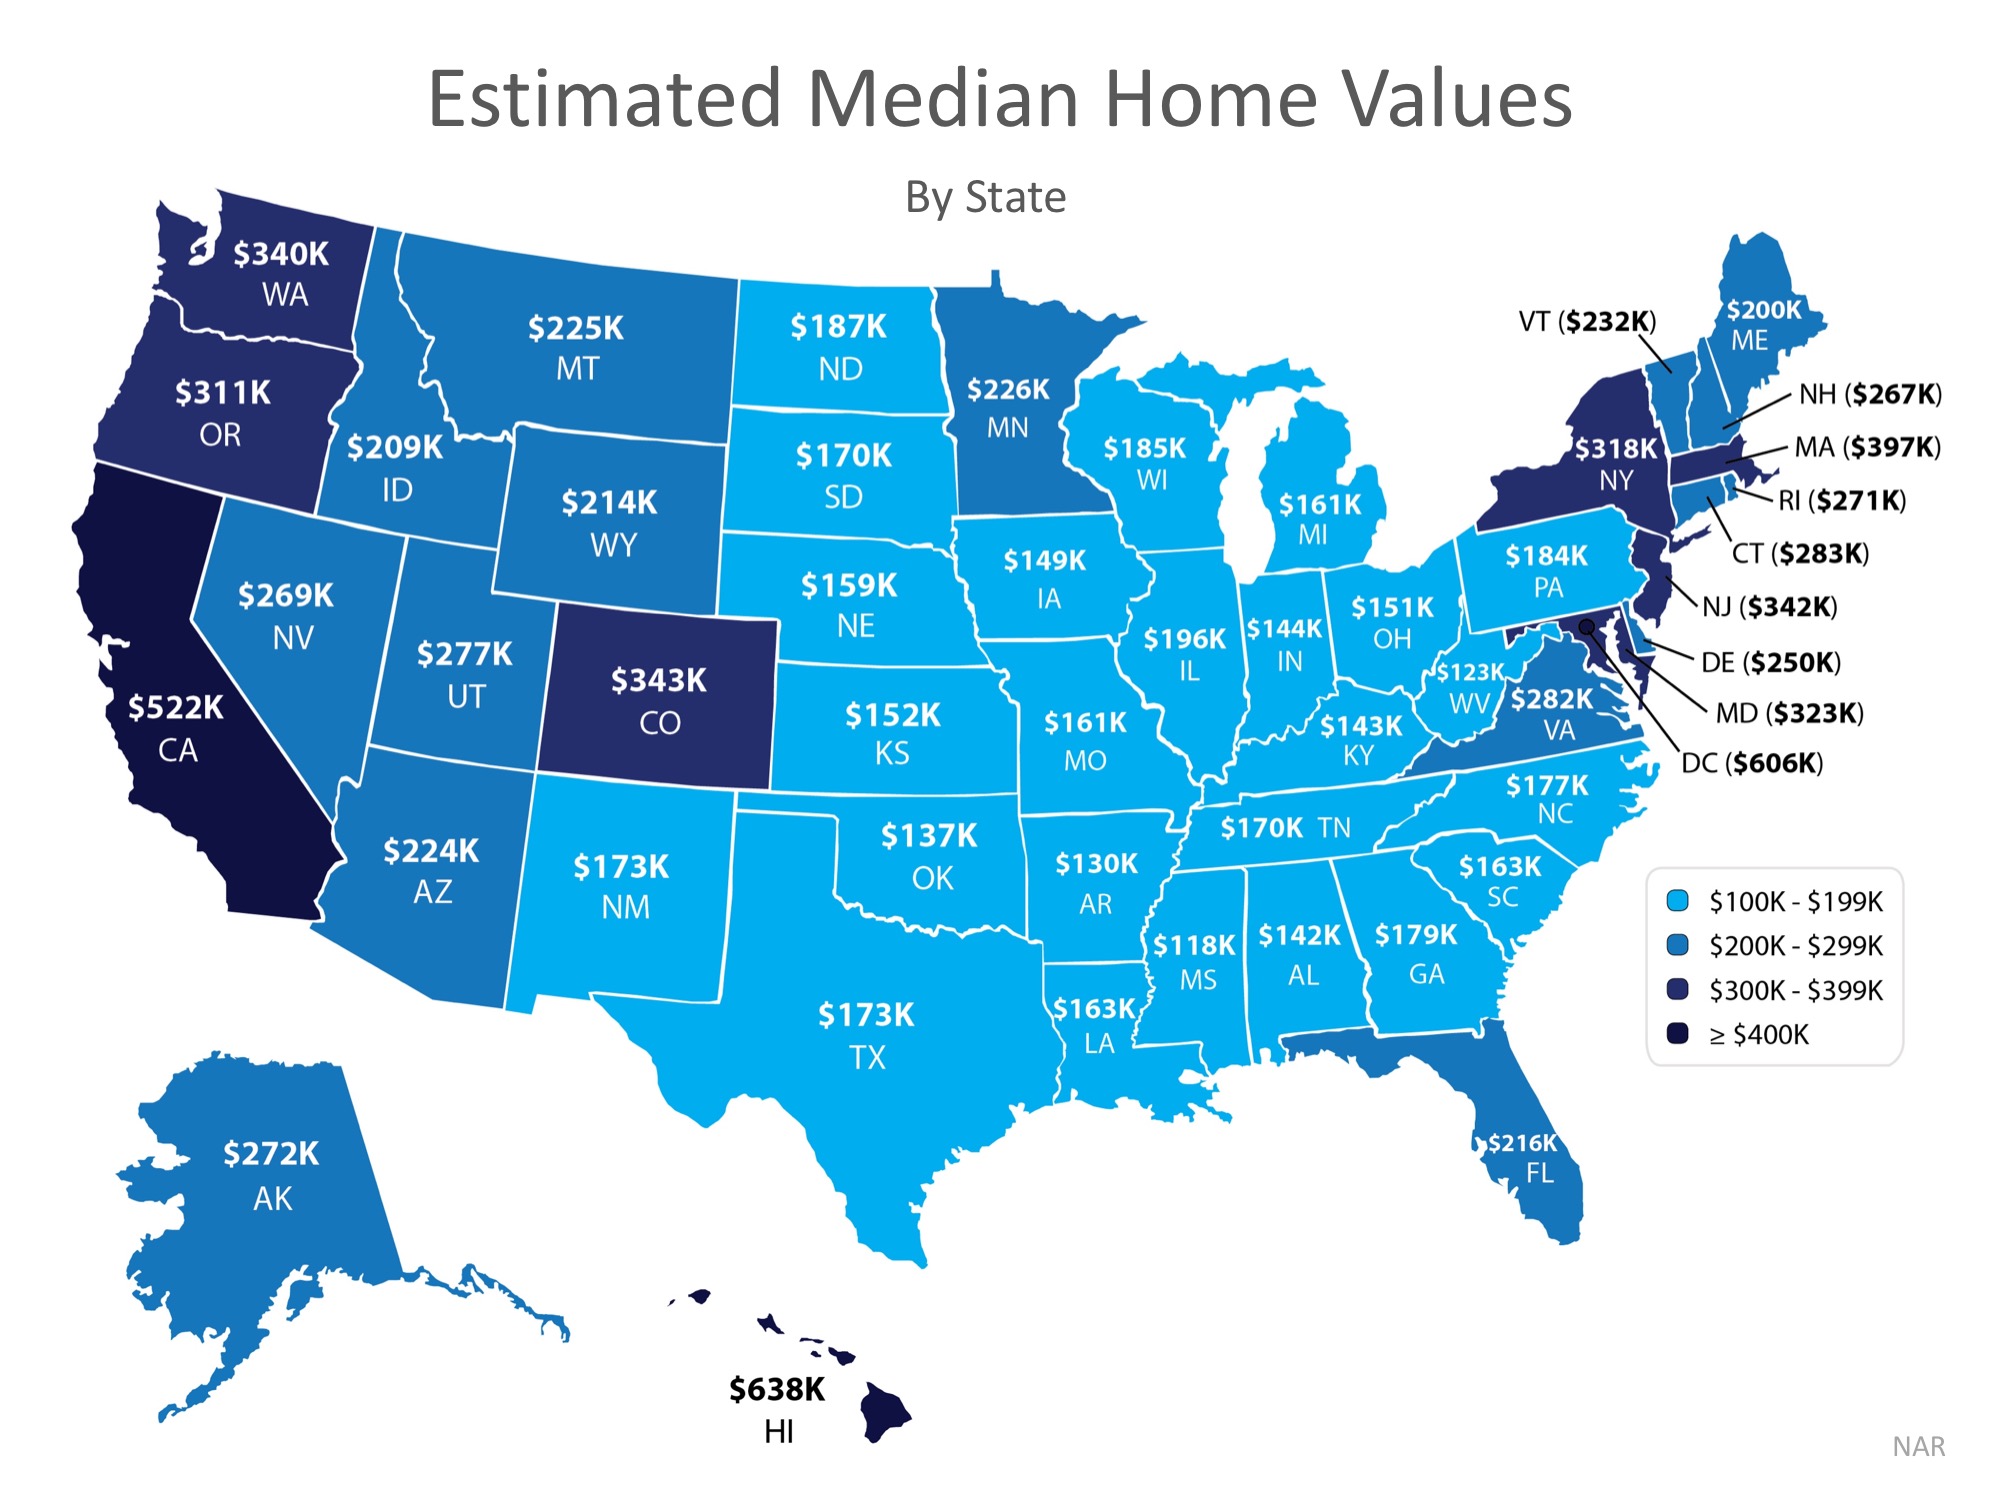
In today’s housing market where home prices are appreciating quickly, it’s important to know that not every home appreciates at the same rate. The map below demonstrates that point on a state-by-state basis using data from the National Association of Realtors.

What’s the Median Home Value in Your State? | Simplifying The Market

Demand often dictates value, even for houses in the same area of the country! High demand for starter and trade-up homes have driven prices up in these categories by nearly 10% over the past year, while those in the premium markets have appreciated at closer to 6%.

Bottom Line

If you are debating whether or not to buy and/or sell a home this year, let’s get together to help you figure out exactly what’s going on in our market.

Filed Under: First Time Home Buyers, For Buyers, For Sellers, Move-Up Buyers, Pricing

Homes are More Affordable in 44 out of 50 States

June 21, 2018 by simplify

Homes are More Affordable in 44 out of 50 States | Simplifying The Market

With both home prices and mortgage rates increasing this year, many are concerned about a family’s ability to purchase a major part of the American Dream – its own home. However, if we compare housing affordability today to the average affordability prior to the housing boom and bust, we are in much better shape than most believe.

In Black Knight’s latest monthly Mortgage Monitor, they revealed that in the vast majority of the country, it is actually more affordable to purchase a home today than it was between 1995 to 2003 when looking at mortgage payments (determined by price and interest rate) as compared to incomes. Home prices are up compared to 1995-2003, but mortgage rates are still much lower now than at that time. Today, they stand at about 4.5%. Here are the average mortgage rates for each of the years mentioned:

  • 1995 – 7.93%
  • 1996 – 7.81%
  • 1997 – 7.6%
  • 1998 – 6.94%
  • 1999 – 7.44%
  • 2000 – 8.05%
  • 2001 – 6.97%
  • 2002 – 6.54%
  • 2003 – 5.83%

On the other hand, wages have risen over the last twenty years.

Black Knight’s research revealed that, when comparing “the share of median income required to buy the median-priced home” today, to the average between 1995 to 2003, it is currently more affordable to purchase a home in 44 of 50 states.

Here is a state map of the percentage change in the price-to-payment ratio. Positive numbers indicate that it is less affordable to buy while negative numbers indicate that it is more affordable.

Homes are More Affordable in 44 out of 50 States | Simplifying The Market

Bottom Line

Whether you are moving up to the home of your dreams or purchasing your first house, it is a great time to buy when looking at historic affordability data.

Filed Under: First Time Home Buyers, For Buyers, Monthly Skinny Video, Move-Up Buyers, Pricing

Did Tax Reform Kill the Luxury Market? NOT SO FAR!

June 7, 2018 by simplify

Did Tax Reform Kill the Luxury Market? NOT SO FAR! | Simplifying The Market

The new tax code limits the deduction of state and local property taxes, as well as income or sales taxes, to a total of $10,000. When the tax reform legislation was put into law at the beginning of the year, some experts felt that it could have a negative impact on the luxury housing market.

Capital Economics:

“The impact on expensive homes could be detrimental, with a limit on the MID raising taxes for those that itemize.”

Mark Zandi of Moody’s Analytics:

“The impact on house prices is much greater for higher-priced homes, especially in parts of the country where incomes are higher and there are thus a disproportionate number of itemizers, and where homeowners have big mortgages and property tax bills.”

The National Association of Realtors (NAR) predicted price declines in “high cost, higher tax areas” because of the tax changes. They forecasted a depreciation of 6.2% in New Jersey and 4.8% in Washington D.C. and New York.

What has actually happened?

Here are a few metrics to consider before we write-off the luxury market:

1. According to NAR’s latest Existing Home Sales Report, here is the percent change in sales from last year:

  • Homes sales between $500,000 – $750,000 are up 11.9%
  • Homes sales between $750,000 – $1M are up 16.8%
  • Homes sales over $1,000,000 are up 26.7%

2. In a report from Trulia, it was revealed that searches for “premium” homes as a percentage of all searches increased from 38.4% in the fourth quarter of 2017 to 41.4% in the first quarter of 2018.

3. According to an article from Bloomberg:

“Median home values nationally rose 8 percent in March compared with a year earlier, while neighborhoods of San Francisco and San Jose, California, have increased more than 25 percent.

Prices in affluent areas in Delaware and New York, such as the Hamptons, also surged more than 20 percent.”

Bottom Line

Aaron Terrazas, Zillow’s Senior Economist, probably summed up real estate’s luxury market the best:

“We are seeing the opposite of what was expected. We have certainly not seen the doomsday predictions play out.”

Filed Under: For Buyers, Housing Market Updates, Move-Up Buyers, Pricing

  • « Previous Page
  • 1
  • …
  • 15
  • 16
  • 17
  • 18
  • Next Page »
Information Deemed Reliable But Not Guaranteed
Licensed In MN

Copyright © 2025 | TeamEmond