Inventory
Lakeville Real Estate

Realtor®.com found that buying a home by age 30 is associated with a 22.5% higher net worth at age 50 compared with purchasing a first home in one’s 40s. Moreover, children raised in homeowner households are 18.4% more likely to become homeowners by age 35. The U.S. homeownership rate stood at 65.7% in the fourth quarter of 2025, the highest level of the year, though still below the pandemic-era high of 67.9% in the second quarter of 2020.
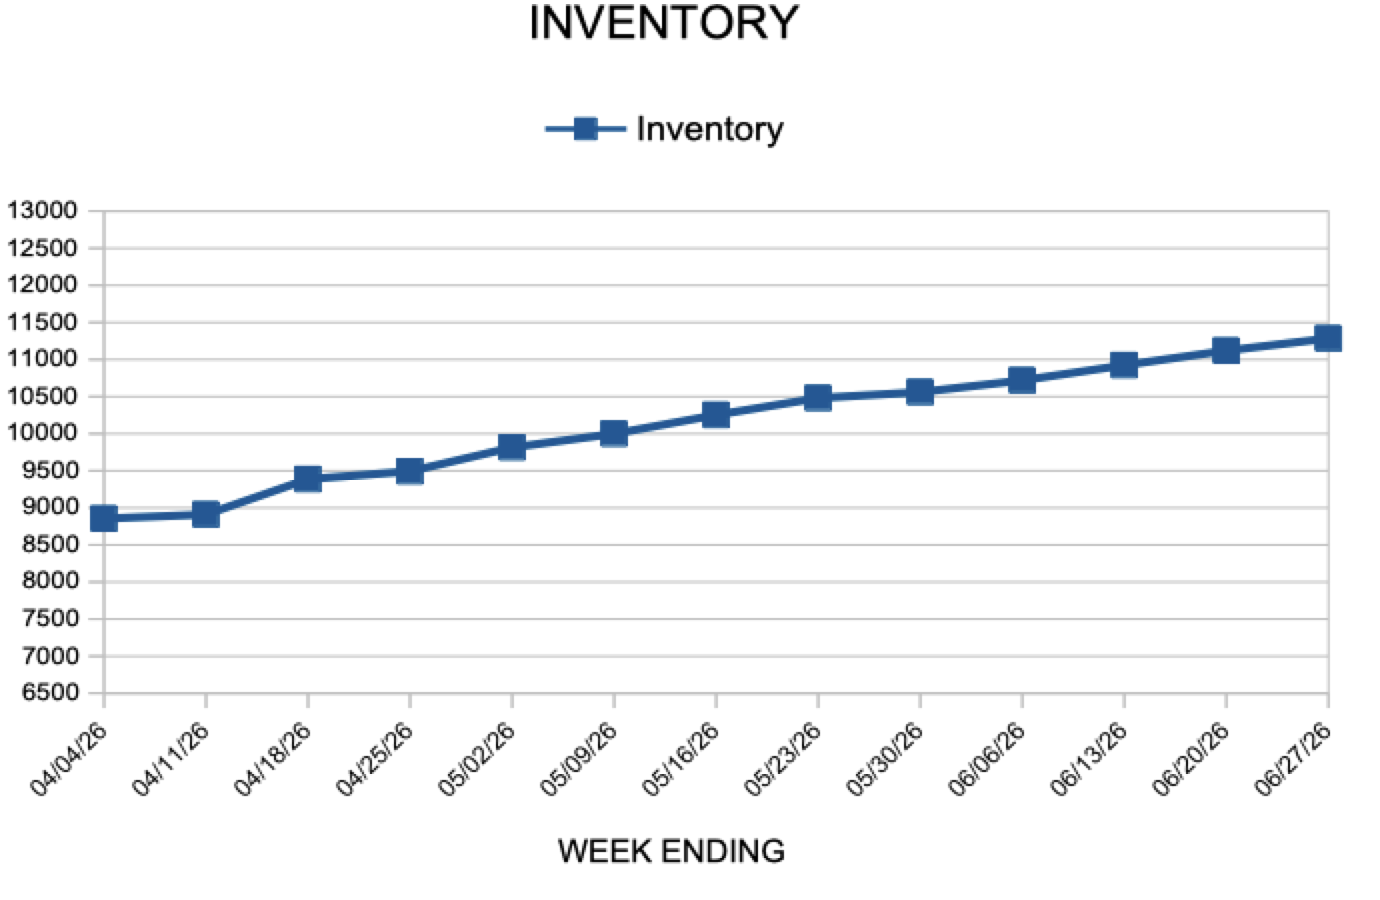
In the Twin Cities region, for the week ending June 27:
For the month of May:
All comparisons are to 2025
Click here for the full Weekly Market Activity Report. From MAAR Market Data News.
The typical U.S. household spends $39,468 per year on bills, or $3,289 per month, accounting for approximately 47% of annual income, according to doxo’s 2026 U.S. Household Bill Pay Report. Of this total, $24,997 is spent on the 13 most essential household expenses, including housing, utilities, and auto loans. Housing remains the single largest expense category, with mortgage payments totaling $1.08 trillion annually.
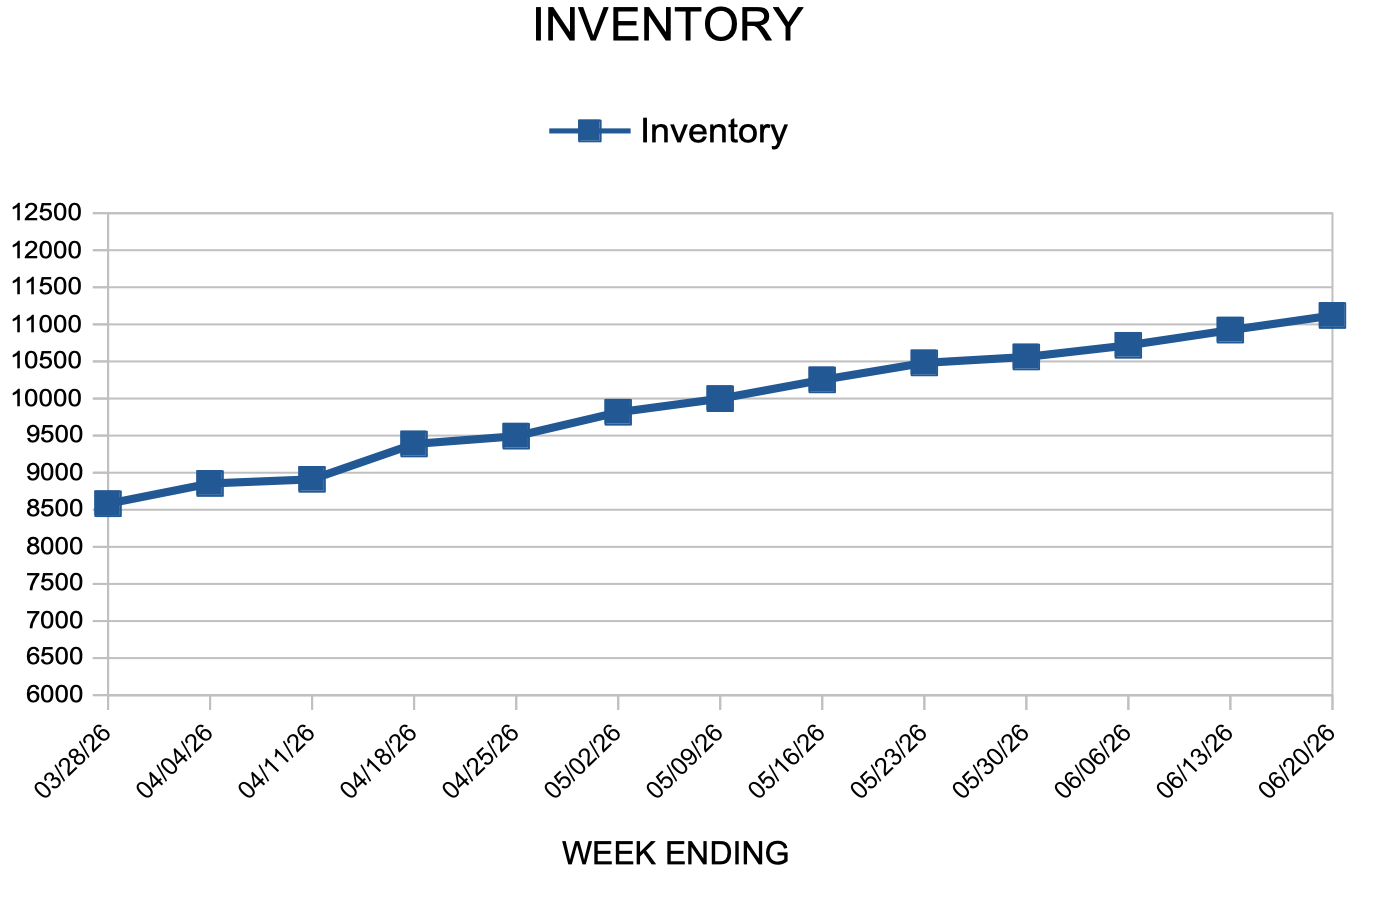
In the Twin Cities region, for the week ending June 20:
For the month of May:
All comparisons are to 2025
Click here for the full Weekly Market Activity Report. From MAAR Market Data News.
The U.S. housing supply gap grew to an estimated 4.03 million homes in 2025, up from 3.8 million in 2024, according to Realtor®.com’s 2026 Housing Supply Gap Report. Last year, approximately 1.4 million households were formed, exceeding 1.36 million new housing starts. 2025 marked the third-largest annual deficit since 2012, behind only 2020 and 2023.
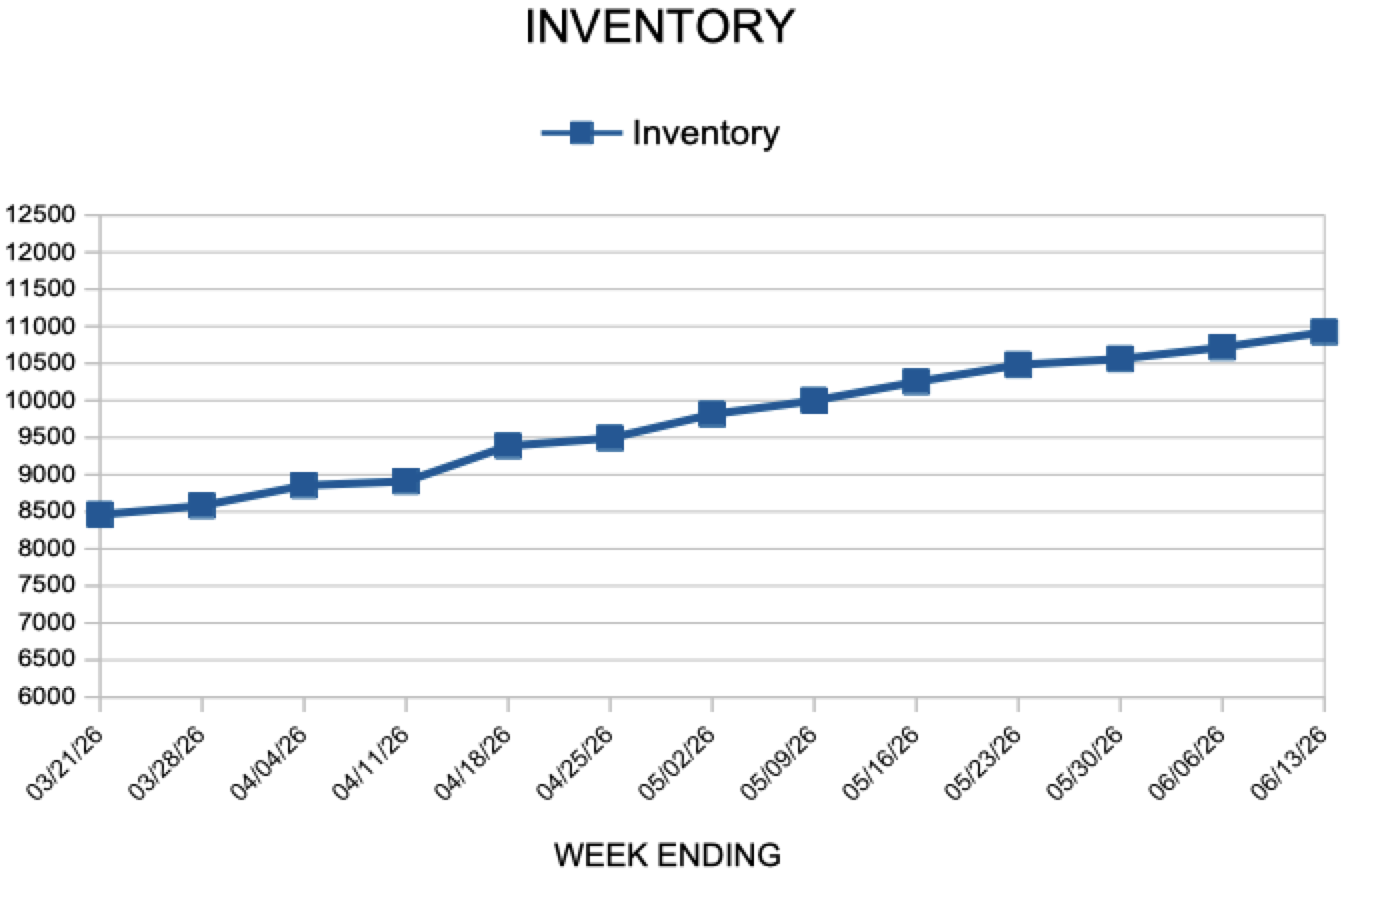
In the Twin Cities region, for the week ending June 13:
For the month of May:
All comparisons are to 2025
Click here for the full Weekly Market Activity Report. From MAAR Market Data News.