![The Tale of Two Markets [INFOGRAPHIC] | Simplifying The Market](https://files.simplifyingthemarket.com/wp-content/uploads/2018/12/04164646/20181207-Share-STM.jpg)
![The Tale of Two Markets [INFOGRAPHIC] | Simplifying The Market](https://files.simplifyingthemarket.com/wp-content/uploads/2018/12/04164547/20181207-STM-ENG.jpg)
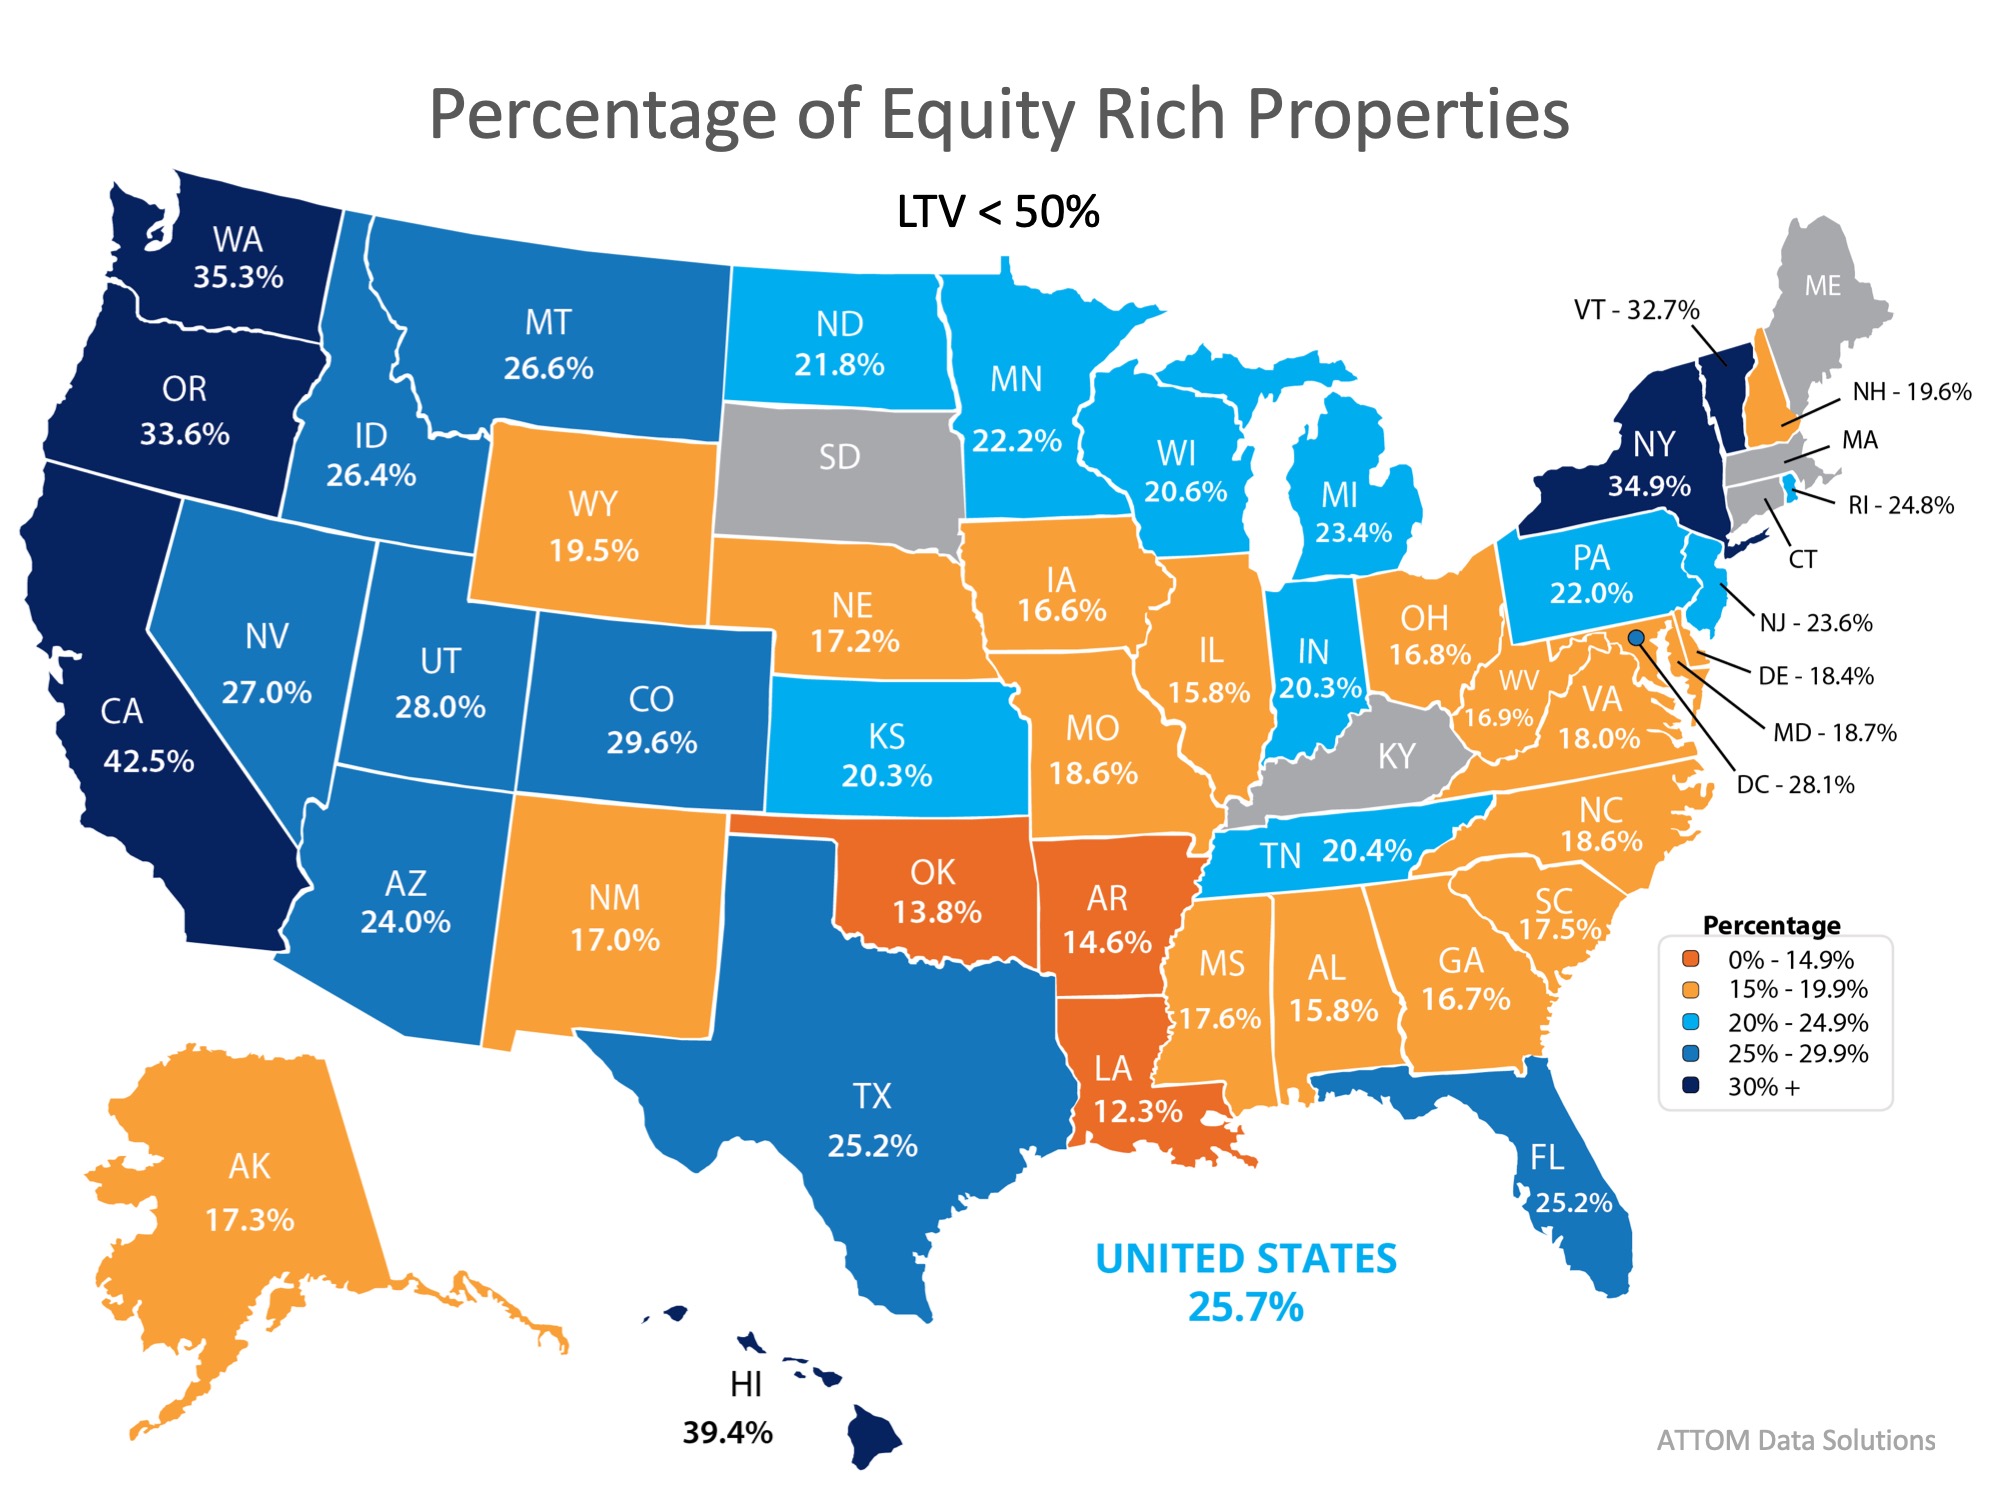
Some Highlights:
- An emerging trend for some time now has been the difference between available inventory and demand in the premium and luxury markets and that in the starter and trade-up markets and what those differences are doing to prices!
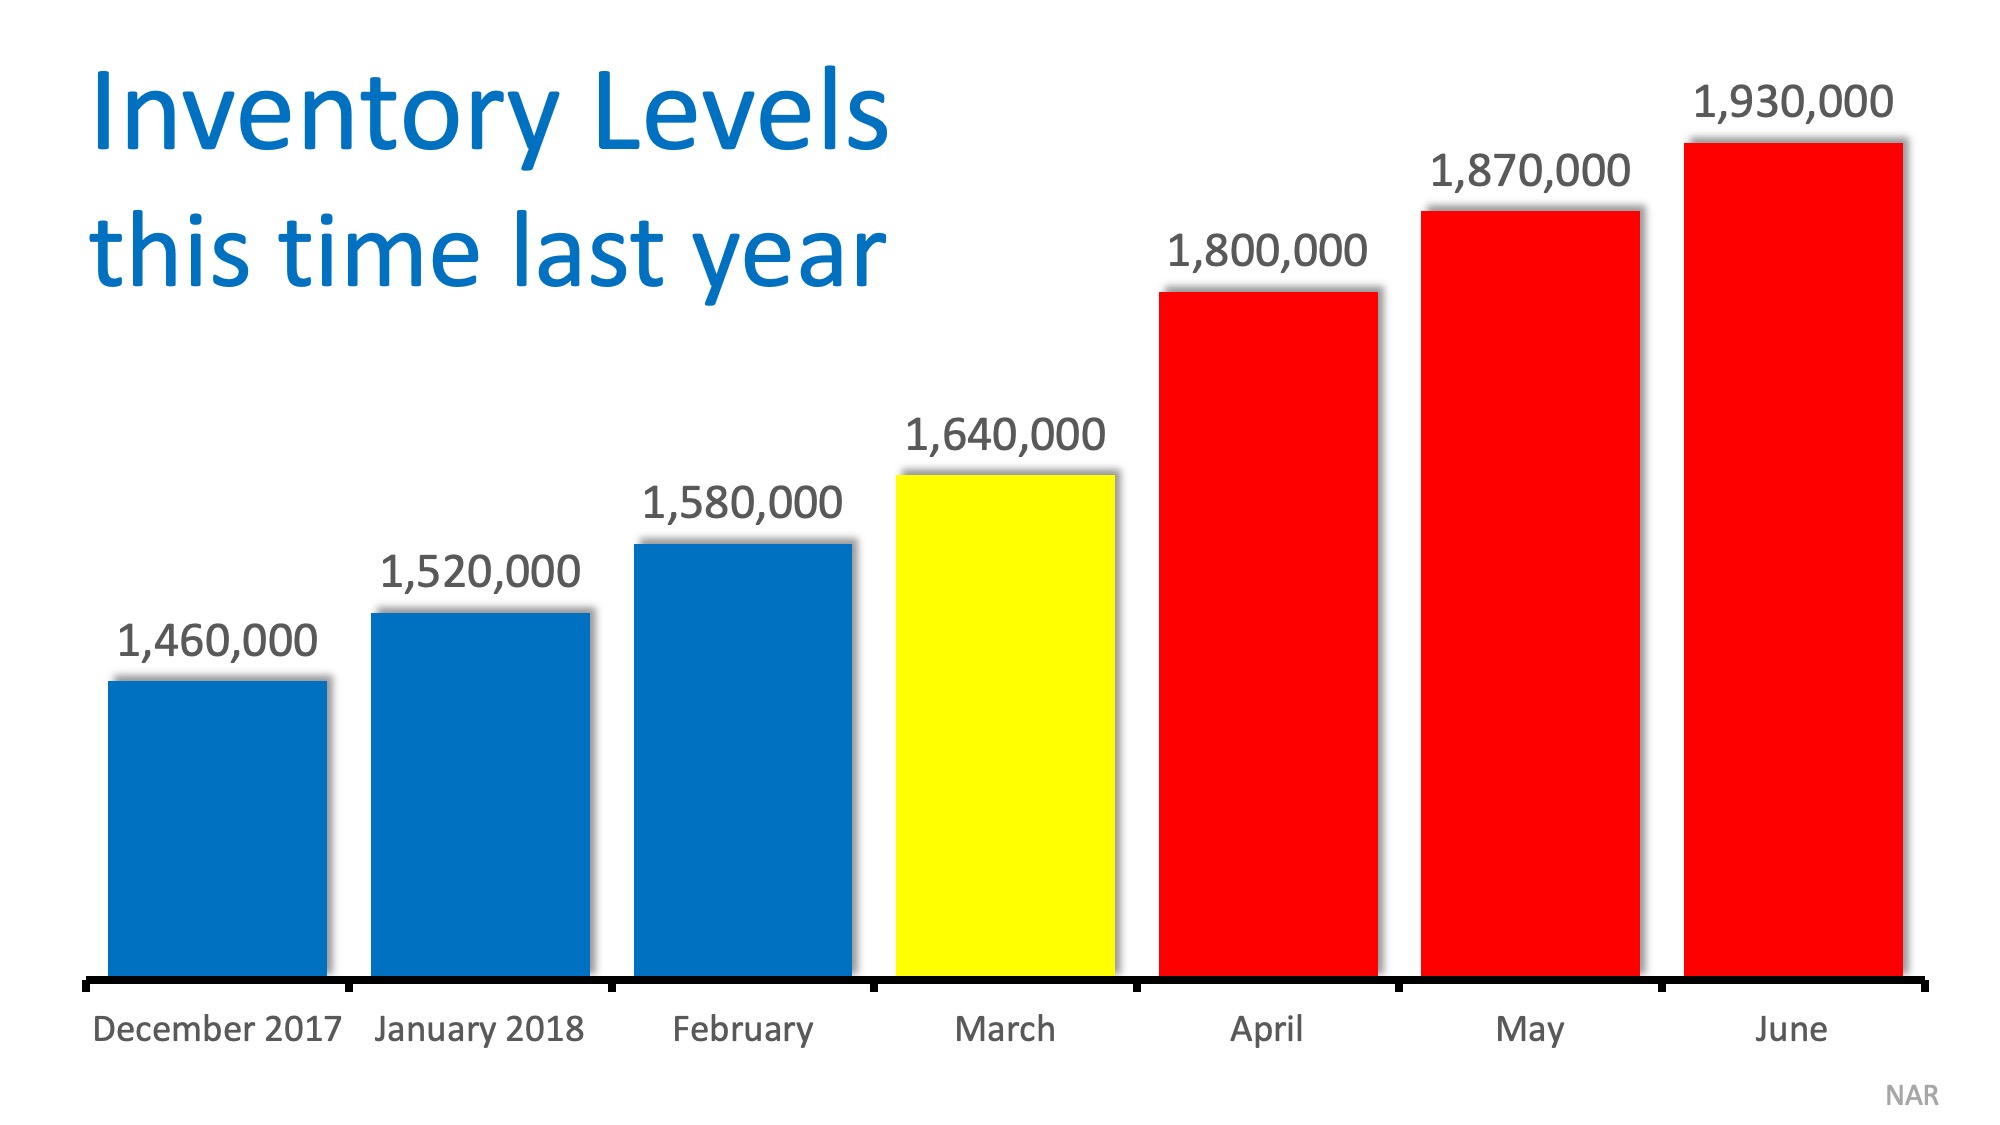
- Inventory continues to rise in the luxury and premium home markets which is causing prices to cool.
- Demand continues to rise with lower-than-normal inventory levels in the starter and trade-up home markets, causing prices to rise on a year-over-year basis for 80 consecutive months.


![Home Prices Up 6.34% Across the Country! [INFOGRAPHIC] | Simplifying The Market](https://files.simplifyingthemarket.com/wp-content/uploads/2018/11/28140426/20181130-STM-ENG.jpg)