Welcome to TeamEmond

  • Home
  • Search
  • Our Listings
  • Buyers
  • Sellers
  • News
  • About TeamEmond
  • Contact
Menu
  • Home
  • Search
  • Our Listings
  • Buyers
  • Sellers
  • News
  • About TeamEmond
  • Contact

Forget the Price of the Home. The Cost is What Matters.

November 7, 2019 by Jim Emond

Forget the Price of the Home. The Cost is What Matters. | Simplifying The Market

Home buying activity (demand) is up, and the number of available listings (supply) is down. When demand outpaces supply, prices appreciate. That’s why firms are beginning to increase their projections for home price appreciation going forward. As an example, CoreLogic increased their 12-month projection for home values from 4.5% to 5.6% over the last few months.

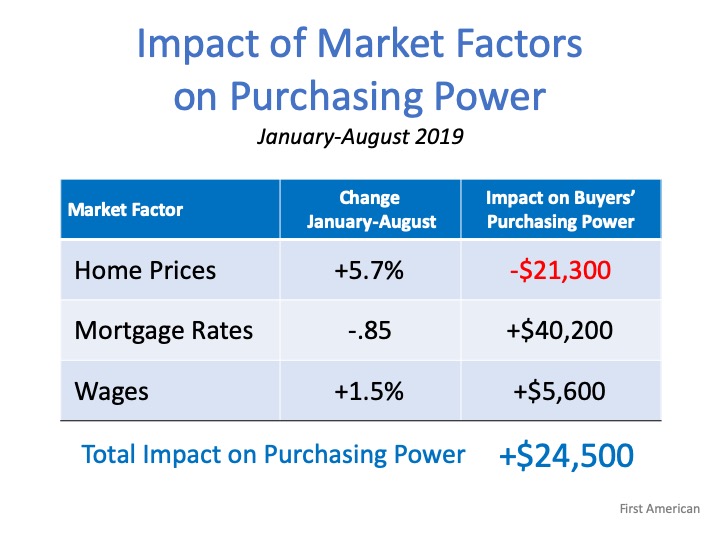
The reacceleration of home values will cause some to again voice concerns about affordability. Just last week, however, First American came out with a data analysis that explains how price is not the only market factor that impacts affordability. They studied prices, mortgage rates, and wages from January through August of this year. Here are their findings:

Home Prices

“In January 2019, a family with the median household income in the U.S. could afford to buy a $373,900 house. By August, that home had appreciated to $395,000, an increase of $21,100.”

Mortgage Interest Rates

“The 0.85 percentage point drop in mortgage rates from January 2019 through August 2019 increased affordability by 9.7%. That translates to a $40,200 improvement in house-buying power in just eight months.”

Wage Growth

“As rates have fallen in 2019, the economy has continued to perform well also, resulting in a tight labor market and wage growth. Wage growth pushes household incomes upward, which were 1.5% higher in August compared with January. The growth in household income increased consumer house-buying power by 1.5%, pushing house-buying power up an additional $5,600.”

When all three market factors are combined, purchasing power increased by $24,500, thus making home buying more affordable, not less affordable. Here is a table that simply shows the data:Forget the Price of the Home. The Cost is What Matters. | Simplifying The Market
Bottom Line

In the article, Mark Fleming, Chief Economist at First American, explained it best:

“Focusing on nominal house price changes alone as an indication of changing affordability, or even the relationship between nominal house price growth and income growth, overlooks what matters more to potential buyers – surging house-buying power driven by the dynamic duo of mortgage rates and income growth. And, we all know from experience, you buy what you can afford to pay per month.”

Filed Under: Housing Market Updates, Monthly Skinny Video, Pricing

The Difference an Hour Will Make This Fall [INFOGRAPHIC]

November 1, 2019 by Jim Emond

The Difference an Hour Will Make This Fall [INFOGRAPHIC] | Simplifying The Market

Every Hour in the U.S. Housing Market: 

  • 614 Homes Are Sold
  • 95 Homes Regain Positive Equity
  • Median Home Values Go Up $1.38


Filed Under: For Buyers, For Sellers, Housing Market Updates, Infographics

Thinking of Selling Your Home? The Waiting Is The Hardest Part.

October 29, 2019 by Jim Emond

Thinking of Selling Your Home? The Waiting Is The Hardest Part. | Simplifying The Market

Tom Petty famously penned the words, “the waiting is the hardest part” in his early 80’s hit song The Waiting, and his thought process can surprisingly also be applied to individuals considering selling their homes today. Traditional thinking would suggest it may be best to wait until the spring to sell when there is a flood of buyers in the market, but right now may in fact be an even better time to list your home.

We can see the overall economy is good: wages are rising, there are near record-low unemployment rates, and mortgage interest rates are still very low too. Over the past 10+ years the housing market has stabilized, so what (if anything) is the biggest challenge in the housing market today?

The answer is simple: it’s inventory.

According to the Existing Home Sales Report by the National Association of Realtors,

“Total housing inventory at the end of September sat at 1.83 million, approximately equal to the amount of existing-homes available for sale in August, but a 2.7% decrease from 1.88 million one year ago. Unsold inventory is at a 4.1-month supply at the current sales pace, up from 4.0 months in August and down from the 4.4-month figure recorded in September 2018.”

What does this mean?

While homes are coming to the market, they aren’t coming fast enough! Right now, across the country there is less than 6 months of overall inventory of homes for sale, putting us in a seller’s market. The challenge is that there are not enough homes for sale to increase the supply needed for the number of people who want to buy, especially in the starter and middle-level markets.

To be in a balanced market (meaning we have enough inventory for the number of buyers in the market), we need to have 6 months of inventory available. Today we are nowhere near that number, and as a matter of fact, the last time we reached that height was August 2012 (as shown in the graph below):Thinking of Selling Your Home? The Waiting Is The Hardest Part. | Simplifying The MarketWhen we look at the inventory challenge today, we can see that now is a great time to sell your house. Truthfully, waiting may end up being the hardest part in the long run. This landscape is a great place for sellers who own homes in the starter and middle-level markets to take the opportunity to sell in a sellers’ market, before inventory catches up with demand. Serious buyers are actively in the market and ready to make a move at this time of year. When inventory is limited at the lower end, like it is today, selling before more homes are listed could mean a significant seller’s advantage to those who are ready to move up. The upper level of the market has much more inventory available to move into, so it’s a win across the board.

Bottom Line

If you’re considering selling your home, don’t wait – now is the time to make your move! Take advantage of the high housing demand and the low inventory of homes for sale at the lower end of the market and use your purchasing power while mortgage rates are low to go after the move-up home of your dreams. Let’s get together to decide if now is the right time for you.

Filed Under: For Sellers, Housing Market Updates

Homes Are Selling Quickly [INFOGRAPHIC]

October 18, 2019 by simplify

Homes Are Selling Quickly [INFOGRAPHIC] | Simplifying The Market

Homes Are Selling Quickly [INFOGRAPHIC] | Simplifying The Market

Some Highlights:

  • The National Association of REALTORS® surveyed their members for the release of their Confidence Index.
  • The REALTORS® Confidence Index is a key indicator of housing market strength based on a monthly survey sent to over 50,000 real estate practitioners. Practitioners are asked about their expectations for home sales, prices, and market conditions.
  • Homes across the country are selling quickly, in an average of just 31 days.
  • 49% of homes sold in less than a month.

Filed Under: For Buyers, For Sellers, Housing Market Updates, Infographics

3 Reasons This is NOT the 2008 Real Estate Market

October 17, 2019 by simplify

3 Reasons This is NOT the 2008 Real Estate Market | Simplifying The Market

Today’s real estate market is nothing like the 2008 market. When an economic slowdown happens, it won’t resemble the last one.

No one knows for sure when the next recession will occur. What is known, however, is that the upcoming economic slowdown will not be caused by a housing market crash, as was the case in 2008. There are those who disagree and are comparing today’s real estate market to the market in 2005-2006, which preceded the crash. In many ways, however, the market is very different now. Here are three suppositions being put forward by some, and why they don’t hold up.

SUPPOSITION #1

A critical warning sign last time was the surging gap between the growth in home prices and household income. Today, home values have also outpaced wage gains. As in 2006, a lack of affordability will kill the market.

Counterpoint

The “gap” between wages and home price growth has existed since 2012. If that is a sign of a recession, why didn’t we have one sometime in the last seven years? Also, a buyer’s purchasing power is MUCH GREATER today than it was thirteen years ago. The equation to determine affordability has three elements:  home prices, wages, AND MORTGAGE INTEREST RATES. Today, the mortgage rate is about 3.5% versus 6.41% in 2006.

SUPPOSITION #2

In 2018, as in 2005, housing-price growth began slowing, with significant price drops occurring in some major markets. Look at Manhattan where home prices are in a “near free-fall.”

Counterpoint

The only major market showing true depreciation is Seattle, and it looks like home values in that city are about to reverse and start appreciating again. CoreLogic is projecting home price appreciation to reaccelerate across the country over the next twelve months.

Regarding Manhattan, home prices are dropping because the city’s new “mansion tax” is sapping demand. Additionally, the new federal tax code that went into effect last year continues to impact the market, capping deductions for state and local taxes, known as SALT, at $10,000. That had the effect of making it more expensive to own homes in states like New York.

SUPPOSITION #3

Prices will crash because that is what happened during the last recession.

Counterpoint

It is true that home values sank by almost 20% during the 2008 recession. However, it is also true that in the four previous recessions, home values depreciated only once (by less than 2%). In the other three, residential real estate values increased by 3.5%, 6.1%, and 6.6%.

Price is determined by supply and demand. In 2008, there was an overabundance of housing inventory (a 9-month supply). Today, housing inventory is less than half of that (a 4-month supply).

Bottom Line

We need to realize that today’s real estate market is nothing like the 2008 market. Therefore, when a recession occurs, it won’t resemble the last one.

Filed Under: First Time Home Buyers, For Buyers, For Sellers, Housing Market Updates, Move-Up Buyers

  • « Previous Page
  • 1
  • …
  • 16
  • 17
  • 18
  • 19
  • 20
  • …
  • 51
  • Next Page »
Information Deemed Reliable But Not Guaranteed
Licensed In MN

Copyright © 2025 | TeamEmond