Welcome to TeamEmond

  • Home
  • Search
  • Our Listings
  • Buyers
  • Sellers
  • News
  • About TeamEmond
  • Contact
Menu
  • Home
  • Search
  • Our Listings
  • Buyers
  • Sellers
  • News
  • About TeamEmond
  • Contact

2020 Forecast Shows Continued Home Price Appreciation

December 23, 2019 by Jim Emond

2020 Forecast Shows Continued Home Price Appreciation | Simplifying The Market

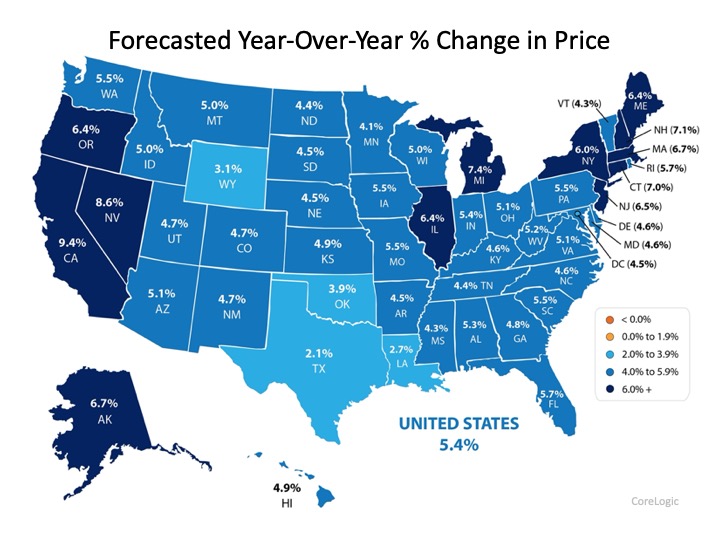
Questions continue to rise around where home prices will head in 2020. The latest forecast from CoreLogic shows continued appreciation at 5.4% over the next year:
2020 Forecast Shows Continued Home Price Appreciation | Simplifying The Market
Additionally, ARCH Mortgage Insurance Company in their current Housing and Mortgage Market Review revealed their latest ARCH Risk Index, which estimates the probability of home prices being lower in two years. Based on the most recent results, 32 of the 50 U.S. states (plus D.C.) had a minimal probability of lowering by 2021.2020 Forecast Shows Continued Home Price Appreciation | Simplifying The Market

Bottom Line

Experts forecast home price appreciation to continue at a moderate rate as we move through 2020 and beyond. With appreciation growing, let’s get together and plan for your next move.

Filed Under: Housing Market Updates, Pricing

Have You Budgeted for Closing Costs?

December 9, 2019 by Jim Emond

Have You Budgeted for Closing Costs? | Simplifying The Market

Saving for a down payment is a key step in the homebuying process, and it’s not the only piece you need to include in your budget. Another factor that’s important to plan for is the closing costs required to obtain a mortgage.

What Are Closing Costs?

According to Trulia,

“When you close on a home, a number of fees are due. They typically range from 2% to 5% of the total cost of the home, and can include title insurance, origination fees, underwriting fees, document preparation fees, and more.”

For those who buy a $250,000 home, for example, that amount could be between $5,000 and $12,500 in closing fees. Keep in mind, if you’re in the market for a home above this price range, your costs could be significantly greater. As mentioned before,

Closing costs are typically between 2% and 5% of your purchase price.

 Trulia gives more great advice, saying,

“There will be lots of paperwork in front of you on closing day, and not enough time to read them all. Work closely with your real estate agent, lender, and attorney, if you have one, to get all the documents you need ahead of time.

The most important thing to read is the closing disclosure, which shows your loan terms, final closing costs, and any outstanding fees. You’ll get this form about three days before closing since, once you (the borrower) sign it, there’s a three-day waiting period before you can sign the mortgage loan docs. If you have any questions about the numbers or what any of the mortgage terms mean, this is the time to ask—your real estate agent is a great resource for getting you all the answers you need.”

Bottom Line

Let’s get together to discuss the homebuying process, to be sure your plan includes budgeting for what you need to purchase your dream home – without any surprises!

Filed Under: First Time Home Buyers, For Buyers, Move-Up Buyers, Pricing

The Cost of Renting vs. Buying a Home [INFOGRAPHIC]

November 15, 2019 by Jim Emond

The Cost of Renting vs. Buying a Home [INFOGRAPHIC] | Simplifying The Market

The Cost of Renting vs. Buying a Home [INFOGRAPHIC] | Simplifying The Market

Some Highlights:

  • Historically, the choice between renting and buying a home has been a tough decision.
  • Looking at the percentage of income needed to rent a median-priced home today (27.7%) vs. the percentage needed to buy a median-priced home (17.5%), the choice is clear.
  • Every market is different. Before you renew your lease, find out if you can put your housing costs to work by buying a home this year.

Filed Under: First Time Home Buyers, For Buyers, Housing Market Updates, Infographics, Pricing, Rent vs. Buy

Forget the Price of the Home. The Cost is What Matters.

November 7, 2019 by Jim Emond

Forget the Price of the Home. The Cost is What Matters. | Simplifying The Market

Home buying activity (demand) is up, and the number of available listings (supply) is down. When demand outpaces supply, prices appreciate. That’s why firms are beginning to increase their projections for home price appreciation going forward. As an example, CoreLogic increased their 12-month projection for home values from 4.5% to 5.6% over the last few months.

The reacceleration of home values will cause some to again voice concerns about affordability. Just last week, however, First American came out with a data analysis that explains how price is not the only market factor that impacts affordability. They studied prices, mortgage rates, and wages from January through August of this year. Here are their findings:

Home Prices

“In January 2019, a family with the median household income in the U.S. could afford to buy a $373,900 house. By August, that home had appreciated to $395,000, an increase of $21,100.”

Mortgage Interest Rates

“The 0.85 percentage point drop in mortgage rates from January 2019 through August 2019 increased affordability by 9.7%. That translates to a $40,200 improvement in house-buying power in just eight months.”

Wage Growth

“As rates have fallen in 2019, the economy has continued to perform well also, resulting in a tight labor market and wage growth. Wage growth pushes household incomes upward, which were 1.5% higher in August compared with January. The growth in household income increased consumer house-buying power by 1.5%, pushing house-buying power up an additional $5,600.”

When all three market factors are combined, purchasing power increased by $24,500, thus making home buying more affordable, not less affordable. Here is a table that simply shows the data:Forget the Price of the Home. The Cost is What Matters. | Simplifying The Market

Bottom Line

In the article, Mark Fleming, Chief Economist at First American, explained it best:

“Focusing on nominal house price changes alone as an indication of changing affordability, or even the relationship between nominal house price growth and income growth, overlooks what matters more to potential buyers – surging house-buying power driven by the dynamic duo of mortgage rates and income growth. And, we all know from experience, you buy what you can afford to pay per month.”

Filed Under: Housing Market Updates, Monthly Skinny Video, Pricing

How to Determine If You Can Afford to Buy a Home

October 30, 2019 by Jim Emond

The gap between the increase in personal income and residential real estate prices has been used to defend the concept that we are experiencing an affordability crisis in housing today.

It is true that home prices and wages are two key elements in any affordability equation. There is, however, an extremely important third component to that equation: mortgage interest rates.

Mortgage interest rates have fallen by more than a full percentage point from this time last year. Today’s rate is 3.75%; it was 4.86% at this time last year. This has dramatically increased a purchaser’s ability to afford a home.

Here are three reports validating that purchasing a home is in fact more affordable today than it was a year ago:

CoreLogic’s Typical Mortgage Payment

“Falling mortgage rates and slower home-price growth mean that many buyers this year are committing to lower mortgage payments than they would have faced for the same home last year. After rising at a double-digit annual pace in 2018, the principal-and-interest payment on the nation’s median-priced home – what we call the “typical mortgage payment”– fell year-over-year again.”  

The National Association of Realtors’ Affordability Index

“At the national level, housing affordability is up from last month and up from a year ago…All four regions saw an increase in affordability from a year ago…Payment as a percentage of income was down from a year ago.”

First American’s Real House Price Index (RHPI)

“In 2019, the dynamic duo of lower mortgage rates and rising incomes overcame the negative impact of rising house price appreciation on affordability. Indeed, affordability reached its highest point since January 2018. Focusing on nominal house price changes alone as an indication of changing affordability, or even the relationship between nominal house price growth and income growth, overlooks what matters more to potential buyers – surging house-buying power driven by the dynamic duo of mortgage rates and income growth. And, we all know from experience, you buy what you can afford to pay per month.”

Bottom Line

Though the price of homes may still be rising, the cost of purchasing a home is actually falling. If you’re thinking of buying your first home or moving up to your dream home, let’s connect so you can better understand the difference between the two.

Filed Under: First Time Home Buyers, For Buyers, Monthly Skinny Video, Move-Up Buyers, Pricing

Think Prices Have Skyrocketed? Look at Rents.

October 24, 2019 by simplify

Think Prices Have Skyrocketed? Look at Rents. | Simplifying The Market

Much has been written about how residential real estate values have increased since the housing market started its recovery in 2012. However, little has been shared about what has taken place with residential rental prices. Let’s shed a little light on this subject.

In the most recent Apartment Rent Report, RentCafe explains how rents have continued to increase over the last twelve months because of a large demand and a limited supply.

 “Continued interest in rental apartments and slowing construction keeps the national average rent on a strong upward trend.”

Zillow, in its latest Rent Index, agreed that rents are continuing on an “upward trend” across most of the country, and that the trend is accelerating:

“The median U.S. rent grew 2% year-over-year, to $1,595 per month. National rent growth is faster than a year ago, and while 46 of the 50 largest markets are showing deceleration in annual home value growth, annual rent growth is accelerating in 41 of the largest 50 markets.”

The Zillow report went on to detail rent increases since the beginning of the housing market recovery in 2012. Here is a graph showing the increases:Think Prices Have Skyrocketed? Look at Rents. | Simplifying The Market

Bottom Line

It is true that home prices have risen over the past seven years, increasing the cost of owning a home. However, the cost of renting a home has also increased over that same time period.

Filed Under: Pricing, Rent vs. Buy

  • « Previous Page
  • 1
  • …
  • 5
  • 6
  • 7
  • 8
  • 9
  • …
  • 18
  • Next Page »
Information Deemed Reliable But Not Guaranteed
Licensed In MN

Copyright © 2025 | TeamEmond