New Listings and Pending Sales
New Listings and Pending Sales
New Listings and Pending Sales
New Listings and Pending Sales
January Housing Market Report
- The median sales price increased 2.3% to $350,000
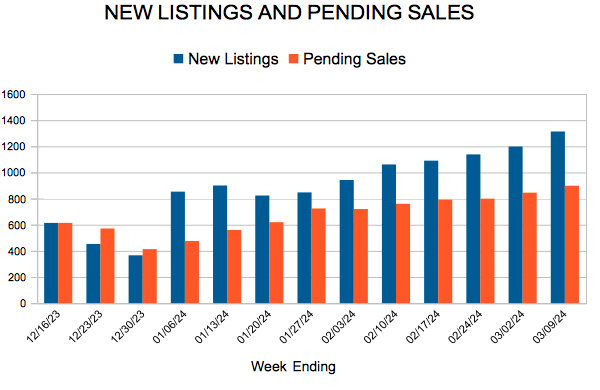
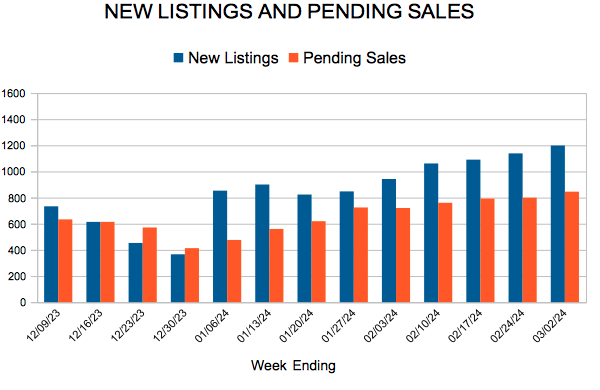
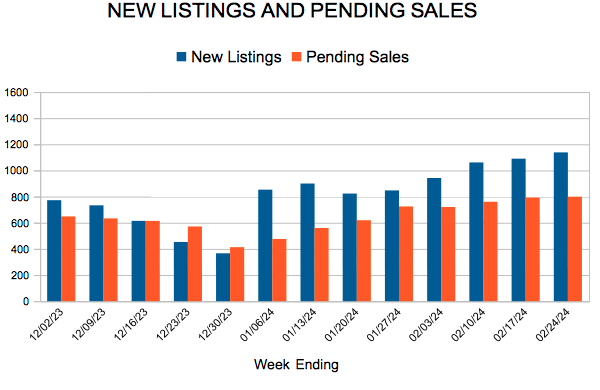
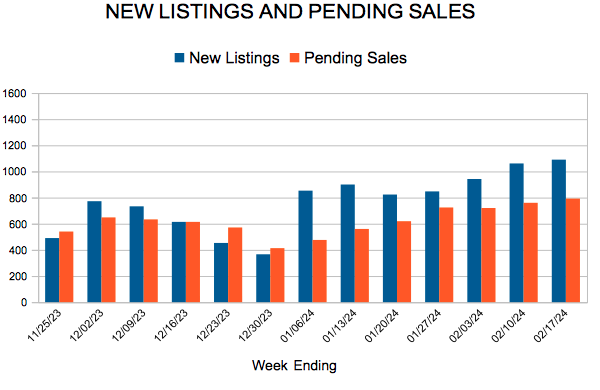
- Signed purchase agreements rose 8.0%; new listings up 18.0%
- Market times fell 8.2% to 56 days; inventory up 1.7% to 6,288
(Feb. 15, 2024) – According to new data from Minneapolis Area REALTORS® and the Saint Paul Area Association of REALTORS®, both buyer and seller activity rose in January. Sales rose from low levels as mortgage rates softened making sellers more confident about listing their homes.
Sellers, Buyers and Housing Supply
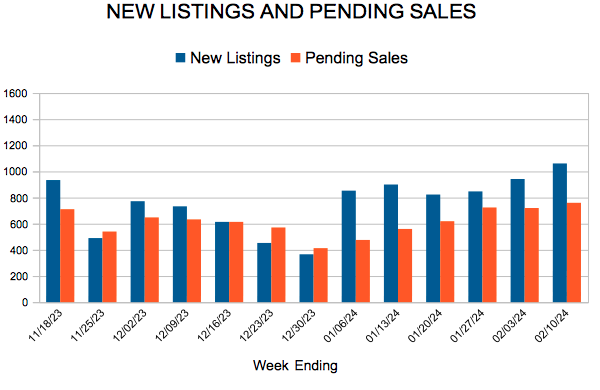
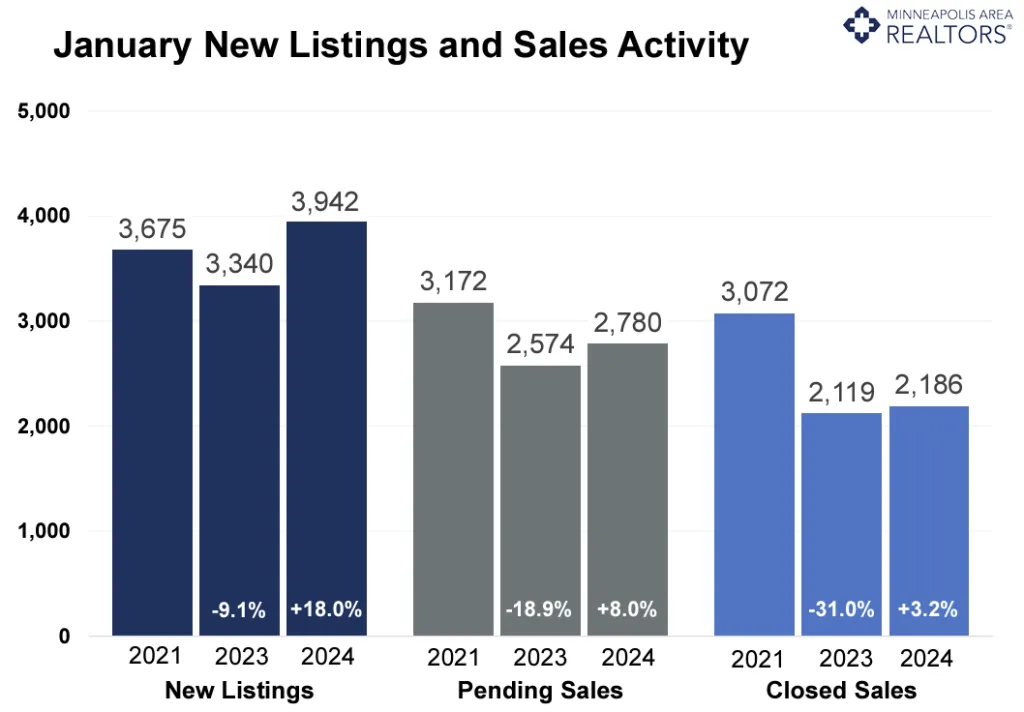
Sellers listed 18.0% more homes than last January. That marked a third consecutive month of year-over-year gains in new listings. Sellers are more optimistic about listing their homes and about getting stronger offers. They’re also feeling better about their payments on the next house. On the demand side, pending sales rose 8.0%, suggesting demand could be stabilizing. That second consecutive gain in signed contracts again was helped by lower rates but also reflects a low baseline period. Three consecutive monthly increases in listings and two consecutive monthly sales gains aren’t enough to lift activity levels back to where they were before mortgage rates rose.
The number of active listings statewide stood at 6,288, or 1.7% more than last January. Aspiring buyers planning on shopping during spring market should expect more competition from pent-up demand and will also face stubbornly low inventory levels. Monthly mortgage payments are of top concern when it comes to household budgets. The increase in mortgage rates combined with higher prices has pushed the monthly payment on the typical home up to $2,700 compared to around $1,800 in 2021. Sellers accepted offers at about 96.7% of list price compared to 96.0% flat last January. “While too early to say for sure, we might look back at December and January as a turning point,” said Jamar Hardy, President of Minneapolis Area REALTORS®. “The easing of rates combined with an increase in listings and inventory should mean somewhat smoother sailing for buyers.”
Prices, Market Times and Negotiations
Supply levels are too low for prices to fall but rates are too high for prices to rise much. The median sales price was up 2.3% to $350,000, which amounted to $199 per square foot. Homes lingered on the market for an average of 56 days, which is actually 8.2% faster than last year. In that time, sellers accepted offers at 96.7% of their asking price, which was up from 2023 but down from 2022. “The market activity is rising from the lows of 2023 and the mood is definitely different,” said Amy Peterson, President of the Saint Paul Area Association of REALTORS®. “As we head further into the spring market, the numbers show it’s still a seller’s market in most areas of the Twin Cities and buyers can position themselves for success by being ready to make a strong offer.”
Affordability, Rates and Payments
The Federal Reserve paused the rate hikes, but the impact of higher mortgage rates on monthly payments is hard to ignore. Mortgage rates hit a 23-year high in October 2023 but have retreated since. Recent data suggests the Federal Reserve may not be as willing to start cutting rates in March. The Housing Affordability Index reached its lowest level for January since at least 2004. Affordability is now at roughly 2006 levels. Using some assumptions around taxes and insurance, the monthly payment on the median priced home stood at $2,680 in 2023 compared to $1,760 in 2021. That additional cost can impact savings rates and discretionary spending in the economy.
Location & Property Type
Market activity always varies by area, price point and property type. New home sales rose at ten times the rate of existing home sales. Townhome sales rose at twice the rate as single family homes. Cities such as Medina, Monticello, New Prague and Rogers saw among the largest sales gains while Oak Grove, New Hope, Maplewood and Belle Plaine all had notably weaker demand.
January 2024 Housing Takeaways (compared to a year ago)
- Sellers listed 3,942 properties on the market, an 18.0% increase from last January
- Buyers signed 2,780 purchase agreements, up 8.0% (2,186 closed sales, up 3.2%)
- Inventory levels rose 1.7% to 6,288 units
- Month’s Supply of Inventory rose 21.4% to 1.7 months (4-6 months is balanced)
- The Median Sales Price was up 2.3 percent to $350,000
- Days on Market was down 8.2% to 56 days, on average (median of 39 days, down 9.3%)
- Changes in Pending Sales activity varied by market segment
- Single family sales rose 7.5%; condo sales were down 8.9%; townhouse sales were up 14.9%
- Traditional sales increased 7.6%; foreclosure sales rose 22.6% to 38; short sales were up 250.0% to 14
- Previously owned sales were up 3.3%; new construction sales increased 33.8%
- Sales under $500,000 rose 6.3%; sales over $500,000 were up 14.6%
- « Previous Page
- 1
- …
- 15
- 16
- 17
- 18
- 19
- …
- 46
- Next Page »

